Fig. 1.
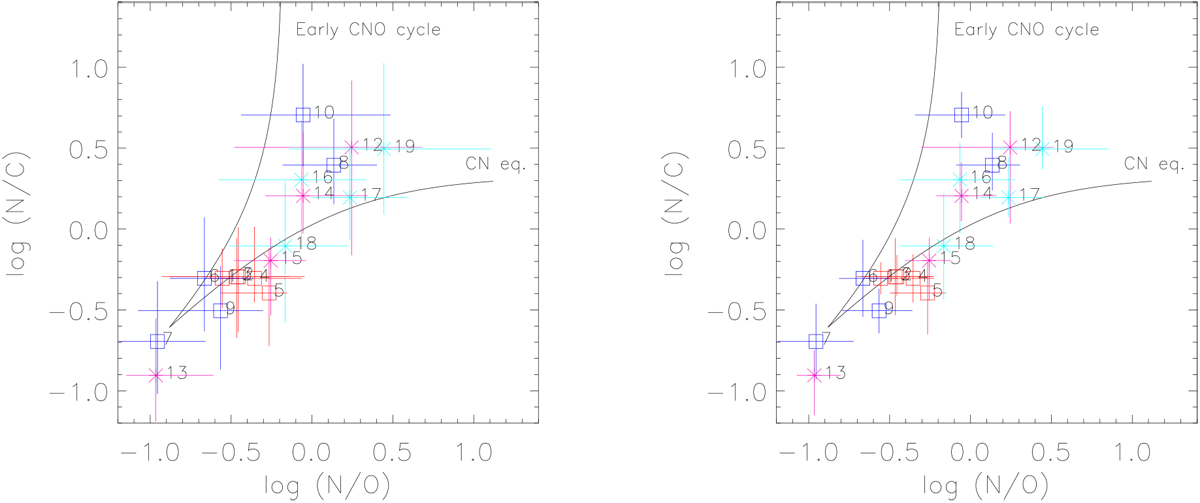
Relation between nitrogen-to-carbon and nitrogen-to-oxygen ratios. Left panel: our results with (approximate) errors when including the uncertainties in Teff and log g. Right panel: only those uncertainties that arise from our method when relying on the Teff and log g values provided by Holgado et al. (2018; see Sect. 5.1). “Hot” and “cold” dwarfs are denoted by blue and red squares, and hot and cold supergiants/bright giants by cyan and magenta asterisks. For our division between hot and cold objects, and the correspondence between number and object, see Table 3. The solid lines represent the theoretical limits for the early phases of the CNO cycle (less massive stars), and for the conversion of O to N after afast establishment of CN equilibrium (most massive stars). Both curves adopt the initial abundances from the Geneva models (Ekström et al. 2012, see Sect. 6.1 and Table 4).
Current usage metrics show cumulative count of Article Views (full-text article views including HTML views, PDF and ePub downloads, according to the available data) and Abstracts Views on Vision4Press platform.
Data correspond to usage on the plateform after 2015. The current usage metrics is available 48-96 hours after online publication and is updated daily on week days.
Initial download of the metrics may take a while.