Fig. 9.
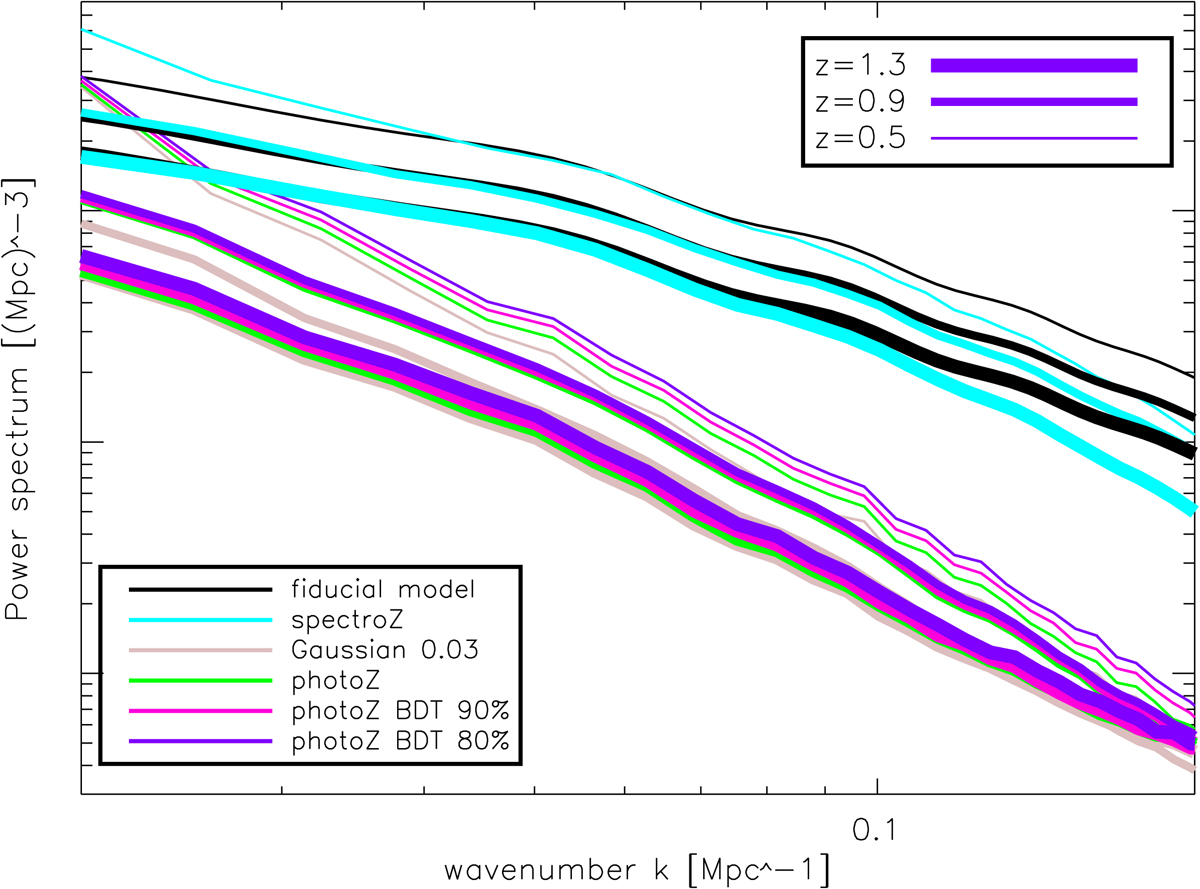
Recovered power spectra PD(k) computed from the five grids centred at each redshift bin, after subtraction of the shot noise contribution. Black lines correspond to the theoretical (input) power spectra while other colours refer to the five redshift error models. The line thickness identifies the grids central redshift. Thickness increases with redshift.
Current usage metrics show cumulative count of Article Views (full-text article views including HTML views, PDF and ePub downloads, according to the available data) and Abstracts Views on Vision4Press platform.
Data correspond to usage on the plateform after 2015. The current usage metrics is available 48-96 hours after online publication and is updated daily on week days.
Initial download of the metrics may take a while.