Open Access
Fig. 7.
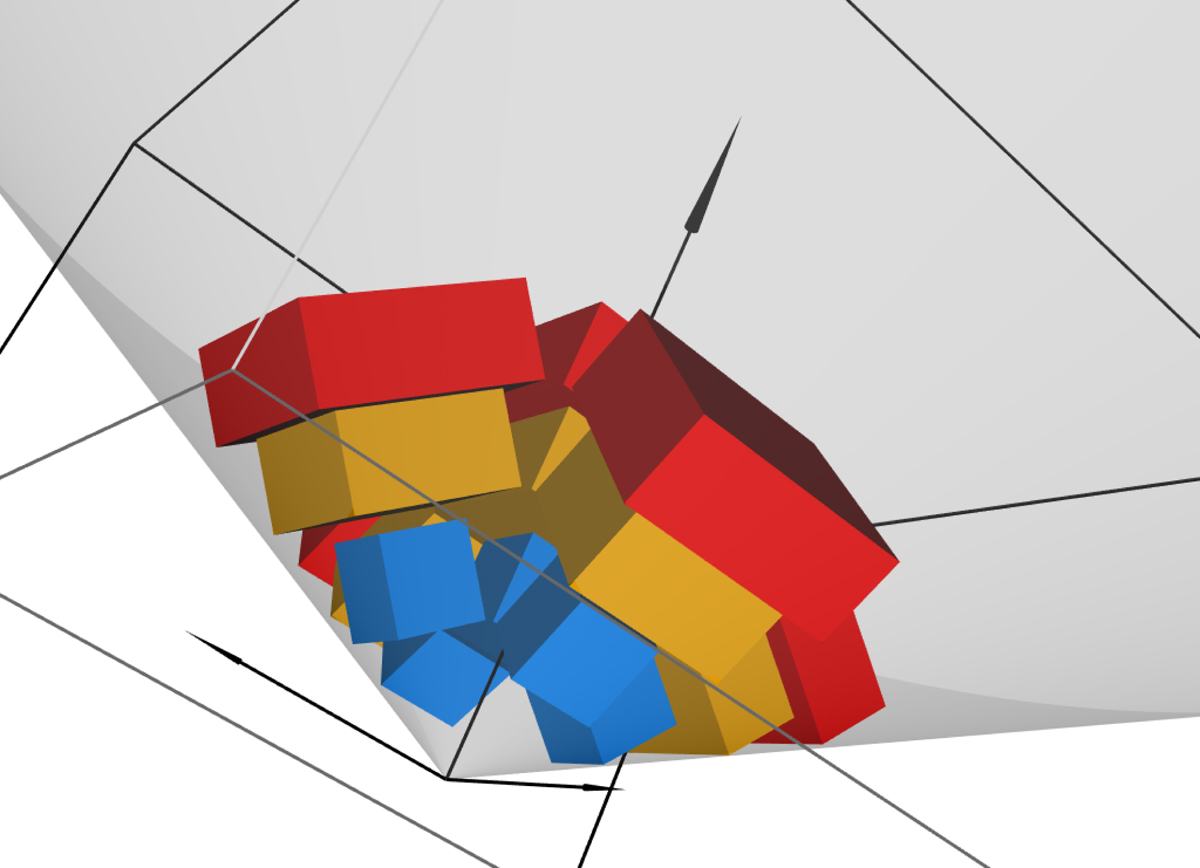
Schematic view of the volumes used in the simulation. The black lines mark out the BigCube. The grey area shows the field of view of π sr which is filled by galaxies from z = 0.2 to z = 2.45. The five grids used to compute each power spectrum are drawn in blue, orange, or red according to their central redshift.
Current usage metrics show cumulative count of Article Views (full-text article views including HTML views, PDF and ePub downloads, according to the available data) and Abstracts Views on Vision4Press platform.
Data correspond to usage on the plateform after 2015. The current usage metrics is available 48-96 hours after online publication and is updated daily on week days.
Initial download of the metrics may take a while.