Open Access
Fig. 6.
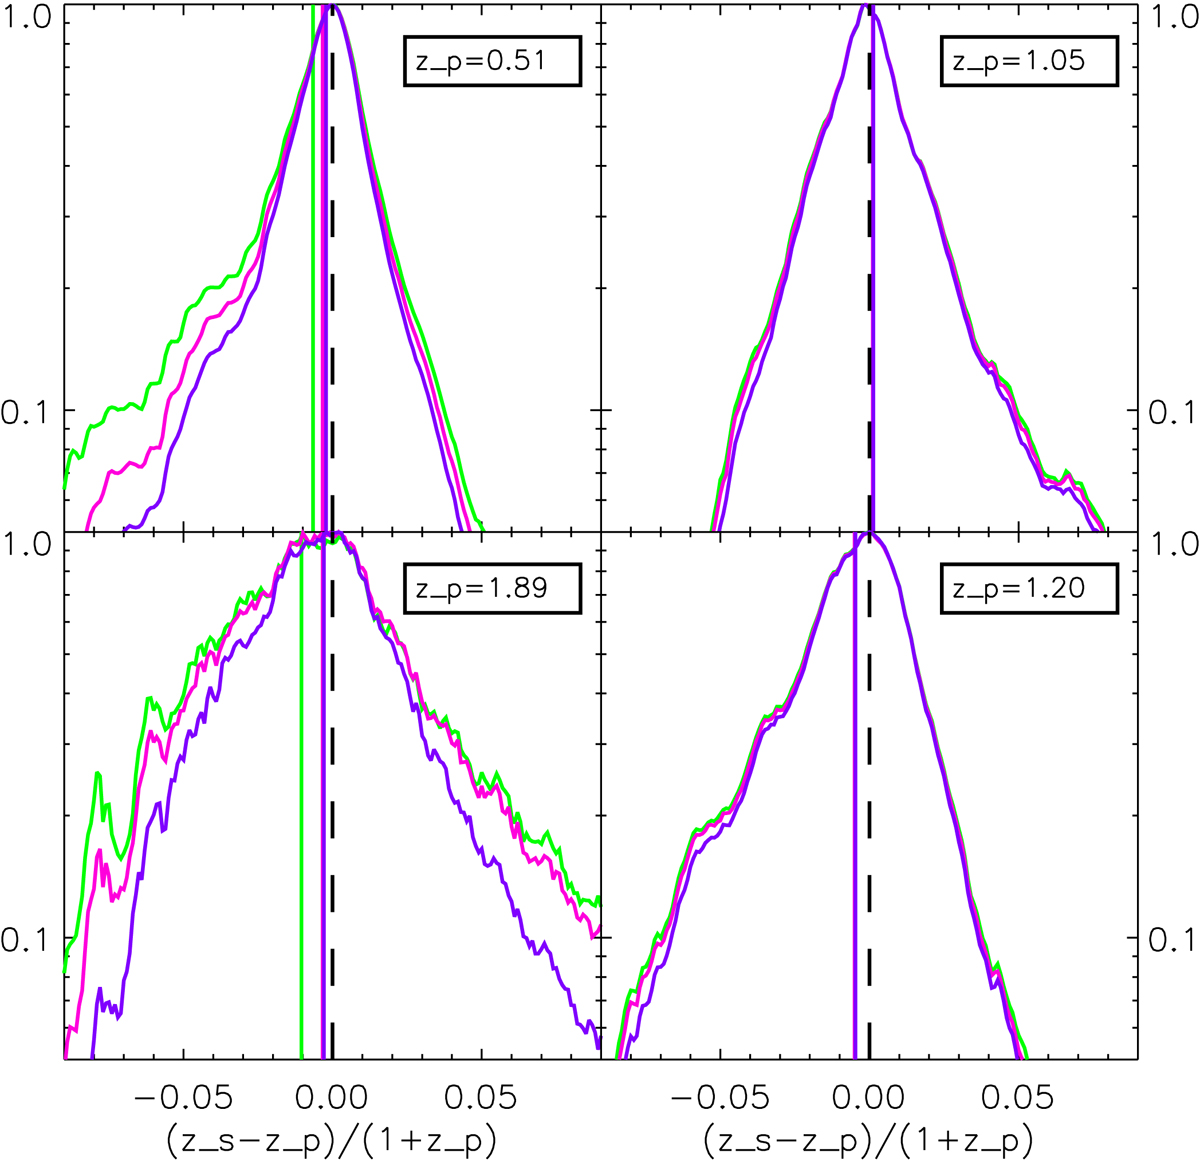
Normalised histogram of ez = (zs − zp)/(1 + zp) for 4 bins in photo-z. The coloured vertical lines show the value of the bias for the 3 error models on the photo-z considered (see Fig. 5 for colour legend) while the dashed black line is the reference at 0.
Current usage metrics show cumulative count of Article Views (full-text article views including HTML views, PDF and ePub downloads, according to the available data) and Abstracts Views on Vision4Press platform.
Data correspond to usage on the plateform after 2015. The current usage metrics is available 48-96 hours after online publication and is updated daily on week days.
Initial download of the metrics may take a while.