Fig. 5.
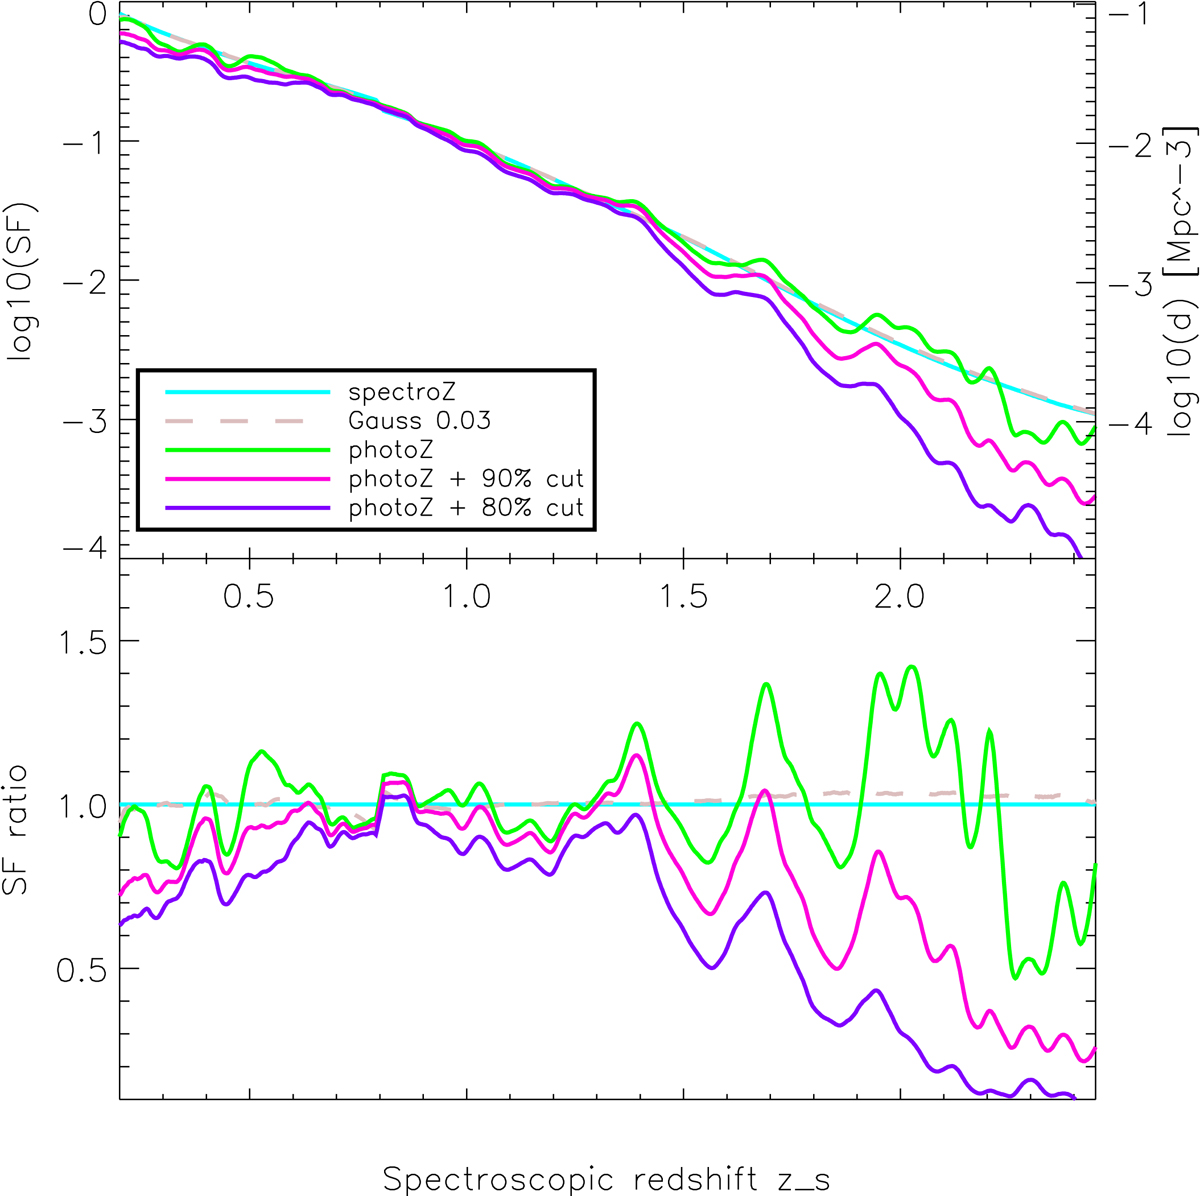
Selection functions SF in the redshift range [0.2−2.45], using the various estimations of the redshift. Top panel: selection functions defined as the ratio between the number of galaxies in the catalogue (passing the LSST golden selection cut) and the number of simulated galaxies. The right axis gives the galaxy density d per Mpc−3. Bottom panel: ratio between the selection functions and the selection function in the spectroscopic case.
Current usage metrics show cumulative count of Article Views (full-text article views including HTML views, PDF and ePub downloads, according to the available data) and Abstracts Views on Vision4Press platform.
Data correspond to usage on the plateform after 2015. The current usage metrics is available 48-96 hours after online publication and is updated daily on week days.
Initial download of the metrics may take a while.