Fig. 4.
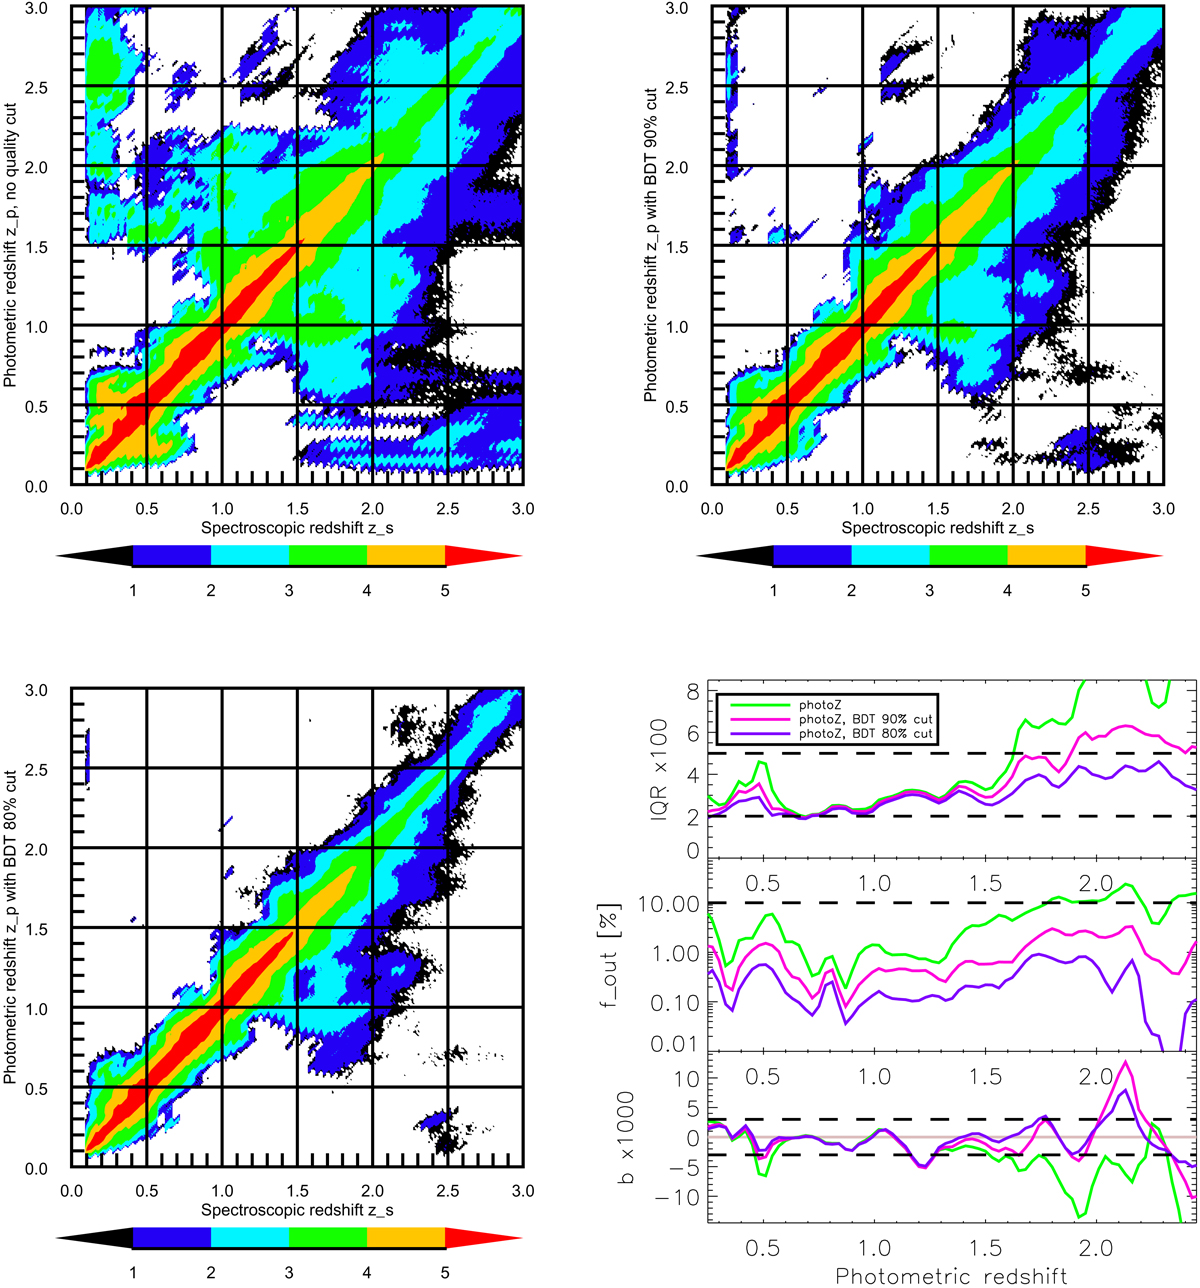
Distribution of the photo-zzp as a function of the spectro-zzs. Top left panel: photo-z from the FastPZ method (see Sect. 3.1.2); top right panel: with the BDT 90% cut; bottom left panel: with the BDT 80% cut. The colour scale for the galaxy density is logarithmic. Bottom right panel: statistical properties of ez = (zs − zp)/(1 + zp) as a function of zp with (top panel) the interquartile range IQR of ez, (middle panel) fraction of outliers fout, defined by |ez|> 0.15, (bottom panel) bias b, defined as the median of ez. Green lines show the values obtained with the photo-z’s without any quality cut while the pink (purple) lines show the results with the photo-z satisfying BDT 90% (BDT 80%) cut. The dashed black lines correspond to the LSST requirements (plus the goal value in the IQR case).
Current usage metrics show cumulative count of Article Views (full-text article views including HTML views, PDF and ePub downloads, according to the available data) and Abstracts Views on Vision4Press platform.
Data correspond to usage on the plateform after 2015. The current usage metrics is available 48-96 hours after online publication and is updated daily on week days.
Initial download of the metrics may take a while.