Open Access
Fig. 12.
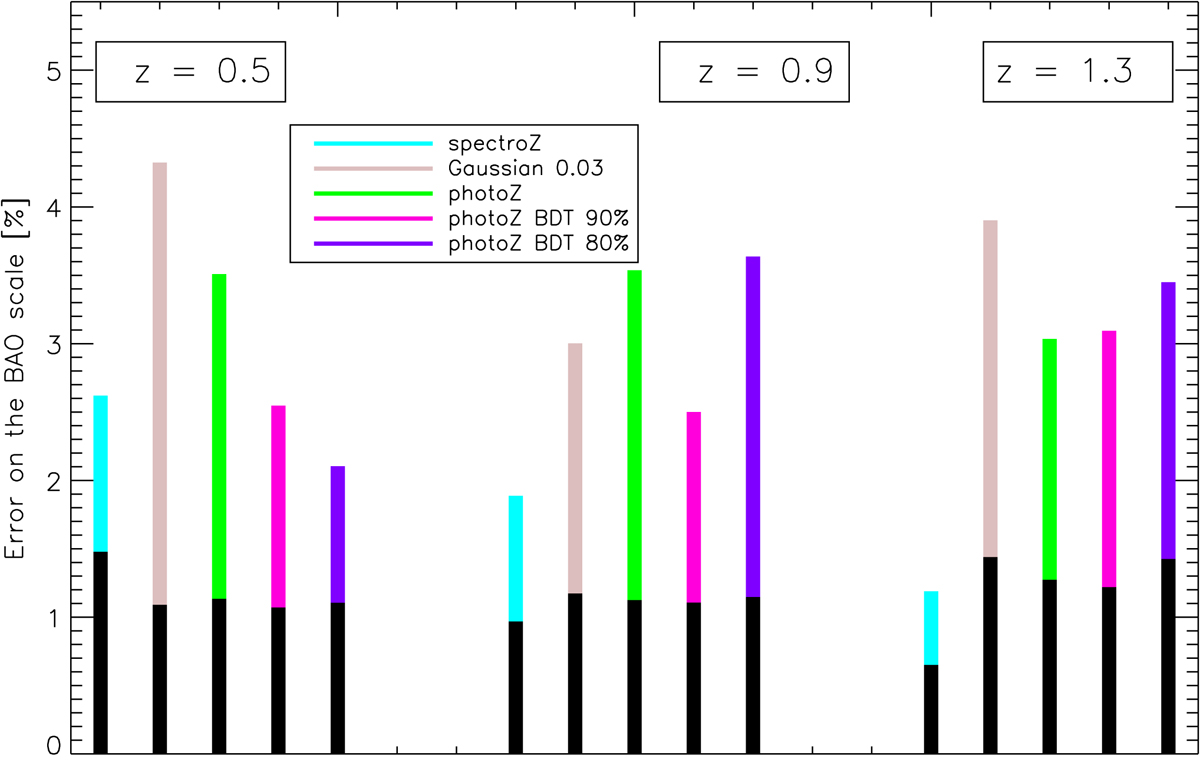
Relative errors on the BAO scale fitted from the power spectra for each redshift and each error model. The black bars are the results using the k-range [0.03−0.1] Mpc−1 while the colour bars are the results using the k-range [0.02−0.07] Mpc−1.
Current usage metrics show cumulative count of Article Views (full-text article views including HTML views, PDF and ePub downloads, according to the available data) and Abstracts Views on Vision4Press platform.
Data correspond to usage on the plateform after 2015. The current usage metrics is available 48-96 hours after online publication and is updated daily on week days.
Initial download of the metrics may take a while.