Fig. 11.
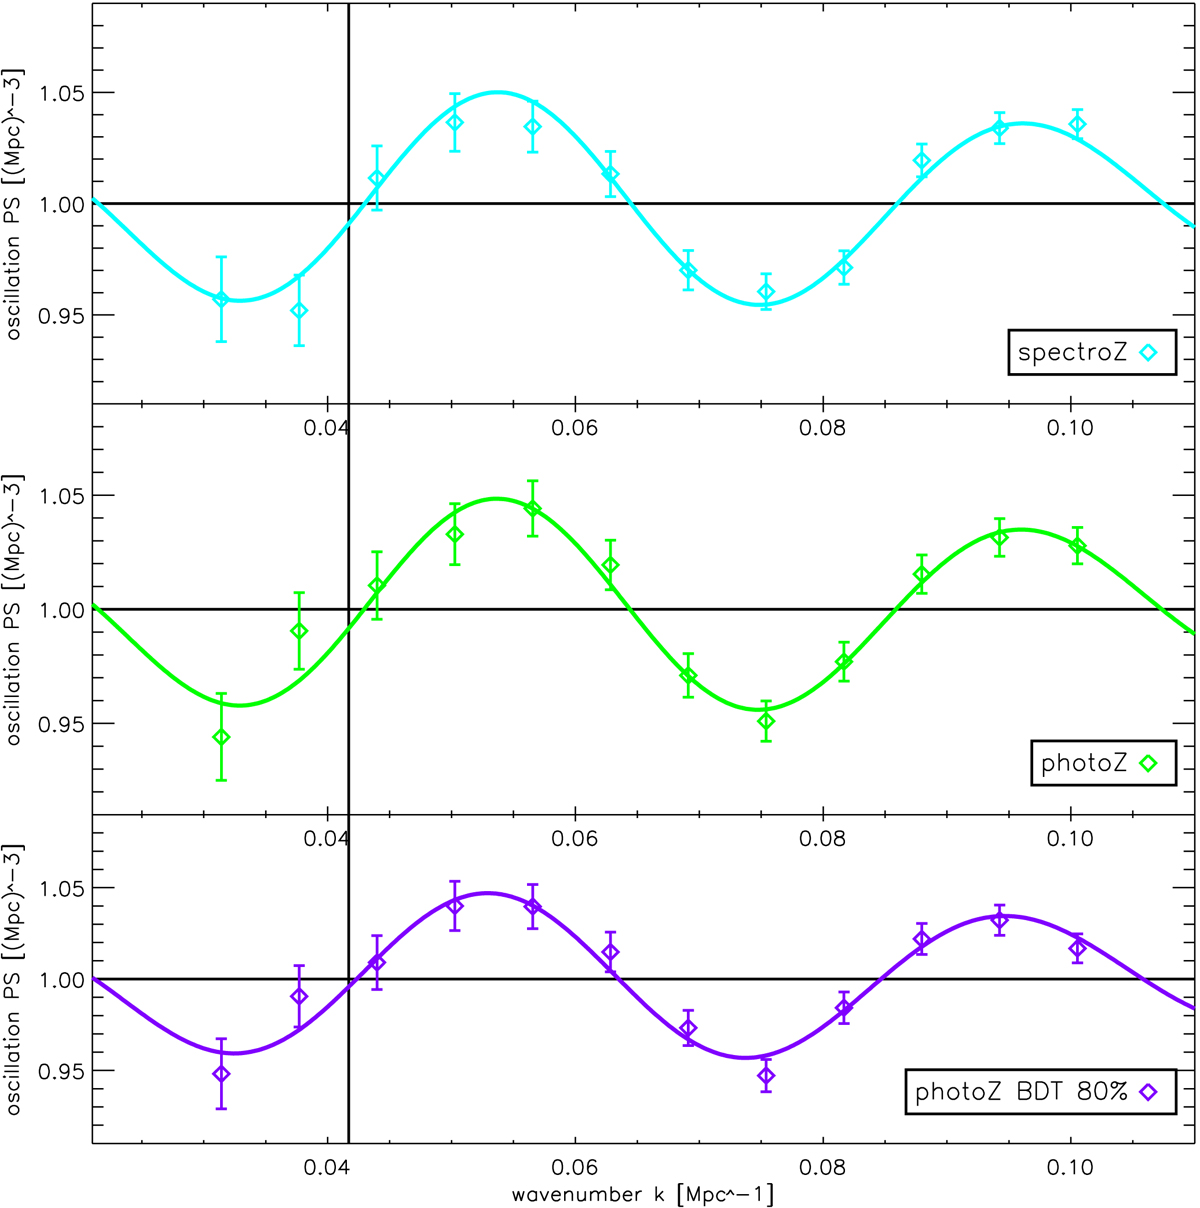
Recovered oscillation part of the power spectra in Fourier space for the grids centred at z = 0.9 considering, from top to bottom panel, spectro-z, photo-z without and with BDT 80% cut. The coloured lines are the fitted oscillations using the simple “wiggle only” description. The BAO scale is at the first intersection between this fitted damped sinusoid and the horizontal black line. The expected value of kA from the fiducial Planck 2015 ΛCDM model (0.0417 Mpc−1) is shown by the vertical line.
Current usage metrics show cumulative count of Article Views (full-text article views including HTML views, PDF and ePub downloads, according to the available data) and Abstracts Views on Vision4Press platform.
Data correspond to usage on the plateform after 2015. The current usage metrics is available 48-96 hours after online publication and is updated daily on week days.
Initial download of the metrics may take a while.