Fig. B.1
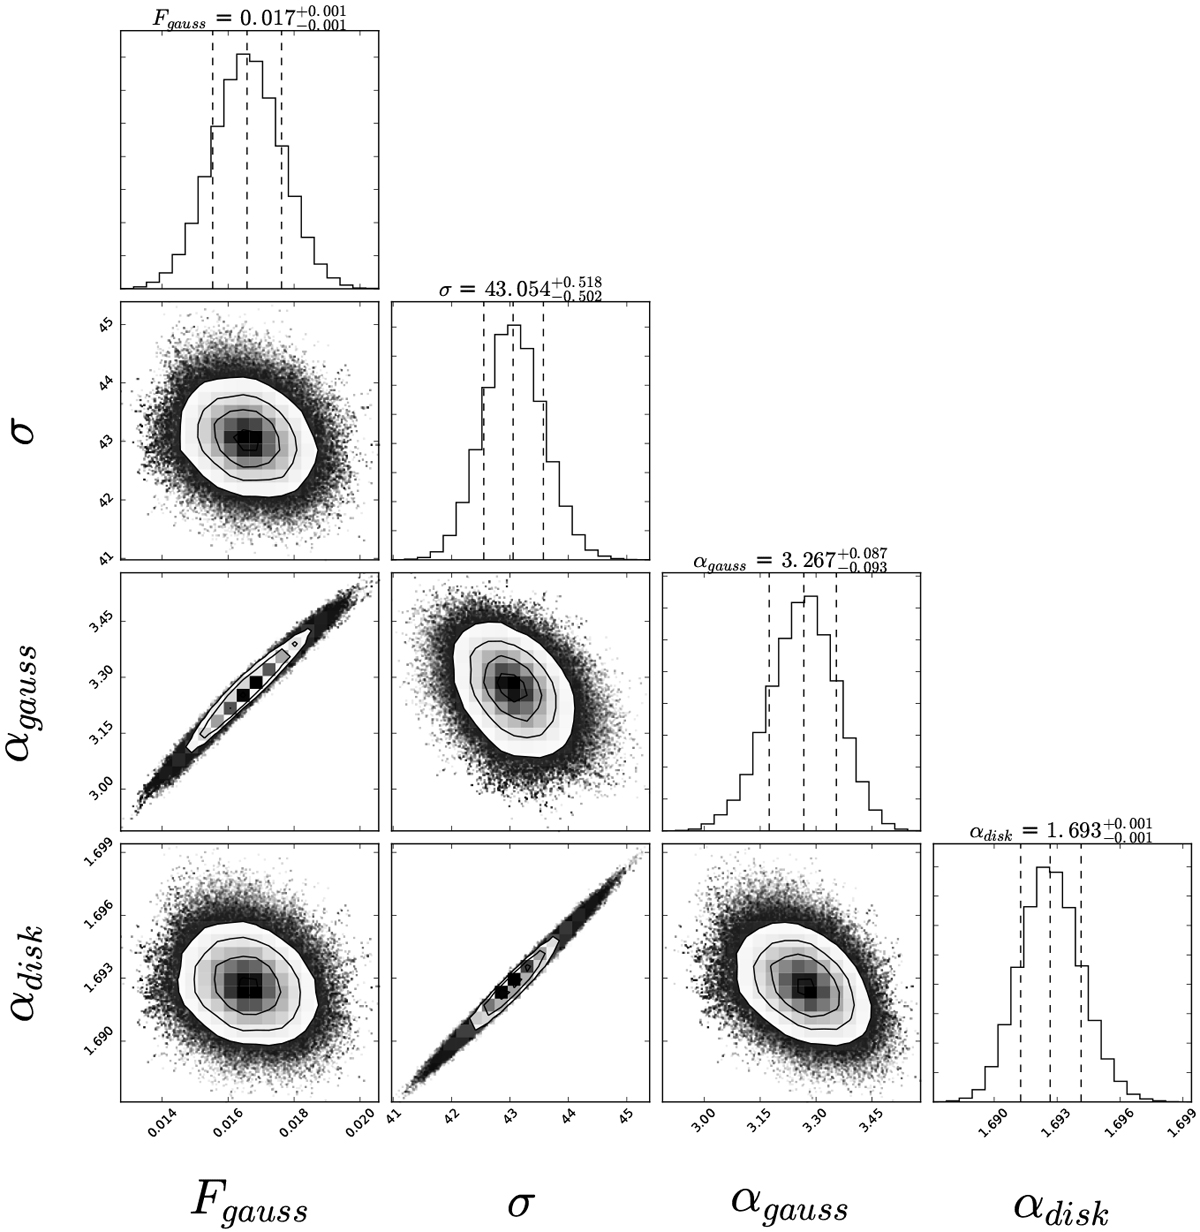
Representation of the MCMC results for Per-emb-50. On the top diagonal, the 1D histograms are the marginalized distributions of the fitted parameters; the vertical dashed lines represent (from left to right panels) the 16th, the 50th, and the 84th percentiles. The 2D density plots represent the bi-variate distributions for each pair of parameters, with one dot representing one sample. The plot shows the posterior sampling provided by 1000 steps of the 400-walkers chain (750 burn-in steps were performed to achieve convergence).
Current usage metrics show cumulative count of Article Views (full-text article views including HTML views, PDF and ePub downloads, according to the available data) and Abstracts Views on Vision4Press platform.
Data correspond to usage on the plateform after 2015. The current usage metrics is available 48-96 hours after online publication and is updated daily on week days.
Initial download of the metrics may take a while.