Fig. 8
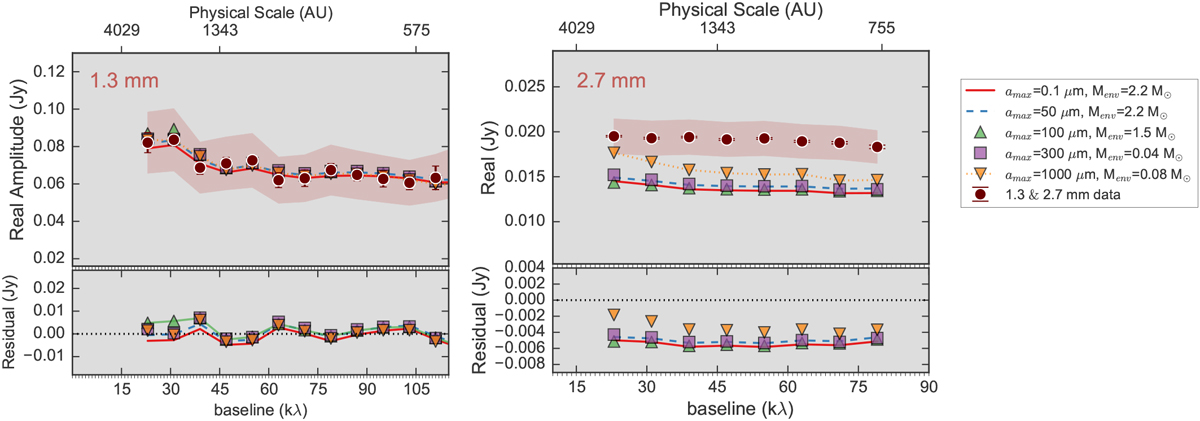
Real part of the visibilities as a function of the deprojected baseline. Left panel: 1.3 mm data. Right panel: 2.7 mm data. Red shaded regions are the uncertainties due the flux calibration. We show a variety of models with a maximum grain size in the envelope of amax = 0.1, 50, 100, 300, 1000 μm. At the bottom of each panel are the residuals between the data and the best model.
Current usage metrics show cumulative count of Article Views (full-text article views including HTML views, PDF and ePub downloads, according to the available data) and Abstracts Views on Vision4Press platform.
Data correspond to usage on the plateform after 2015. The current usage metrics is available 48-96 hours after online publication and is updated daily on week days.
Initial download of the metrics may take a while.