Fig. 7
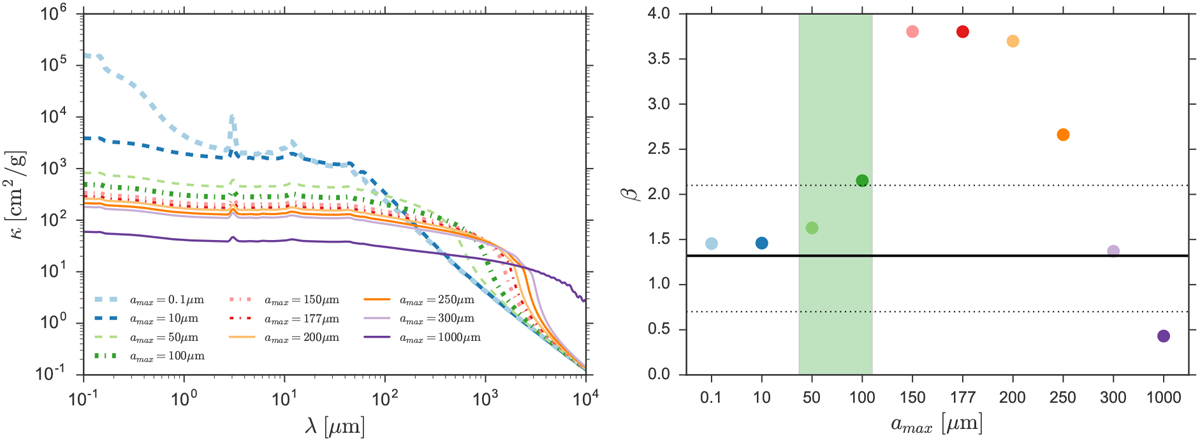
Left panel: dust absorption opacity as a function of wavelength for grain size distributions characterized by (a) ∝ a−3.0 and increasing maximum grain size (amax). Right panel: dust opacity spectral index (β) calculated between 1.3 and 2.7 mm wavelengths as a function of the maximum grain size. Black solid line is the βenv value from the parametric model and the black dashed lines are the uncertainties. Green region shows an upper limit for amax in the envelope of Per-emb-50.
Current usage metrics show cumulative count of Article Views (full-text article views including HTML views, PDF and ePub downloads, according to the available data) and Abstracts Views on Vision4Press platform.
Data correspond to usage on the plateform after 2015. The current usage metrics is available 48-96 hours after online publication and is updated daily on week days.
Initial download of the metrics may take a while.