Fig. 6
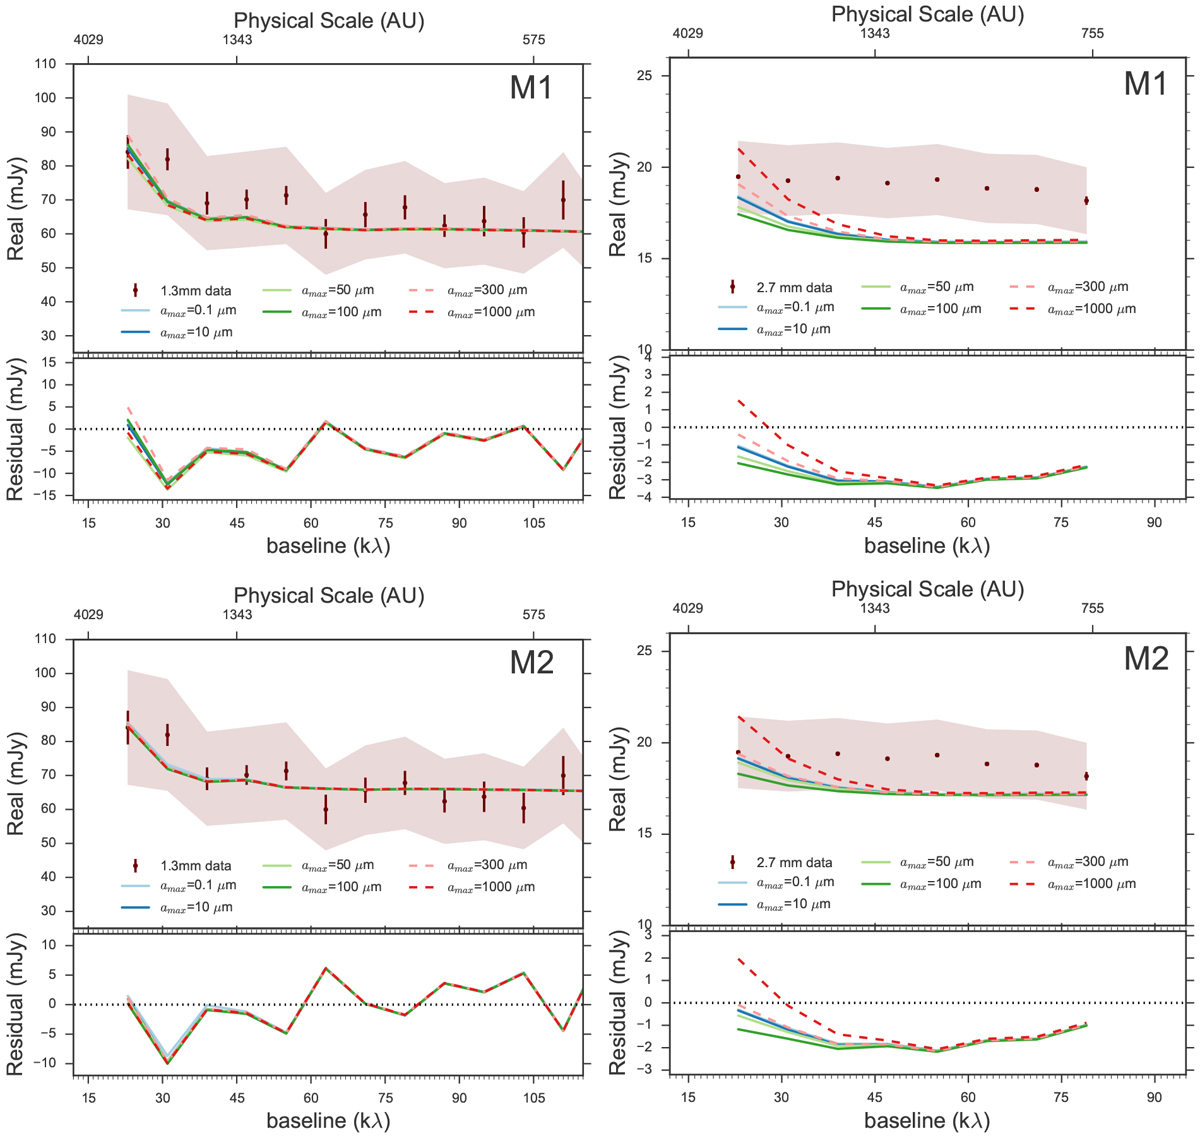
Realpart of the visibilities as a function of baseline. Left panels: 1.3 mm data. Right panels: 2.7 mm data. Upper panels: models with the disk model M1. Bottom panels: models using disk model M2 (see Table 6). In solid lines we present models with grain sizes of amax ≤ 100 μm. In dashed lines are models with grain sizes of amax = 300, 1000 μm. The best fits are the models with a distribution of grain sizes with amax ≤ 100μm. The red shaded region is the uncertainty on the data due to flux calibration. The bottom of each panel shows the residuals between the data and the model with different amax.
Current usage metrics show cumulative count of Article Views (full-text article views including HTML views, PDF and ePub downloads, according to the available data) and Abstracts Views on Vision4Press platform.
Data correspond to usage on the plateform after 2015. The current usage metrics is available 48-96 hours after online publication and is updated daily on week days.
Initial download of the metrics may take a while.