Open Access
Fig. 5
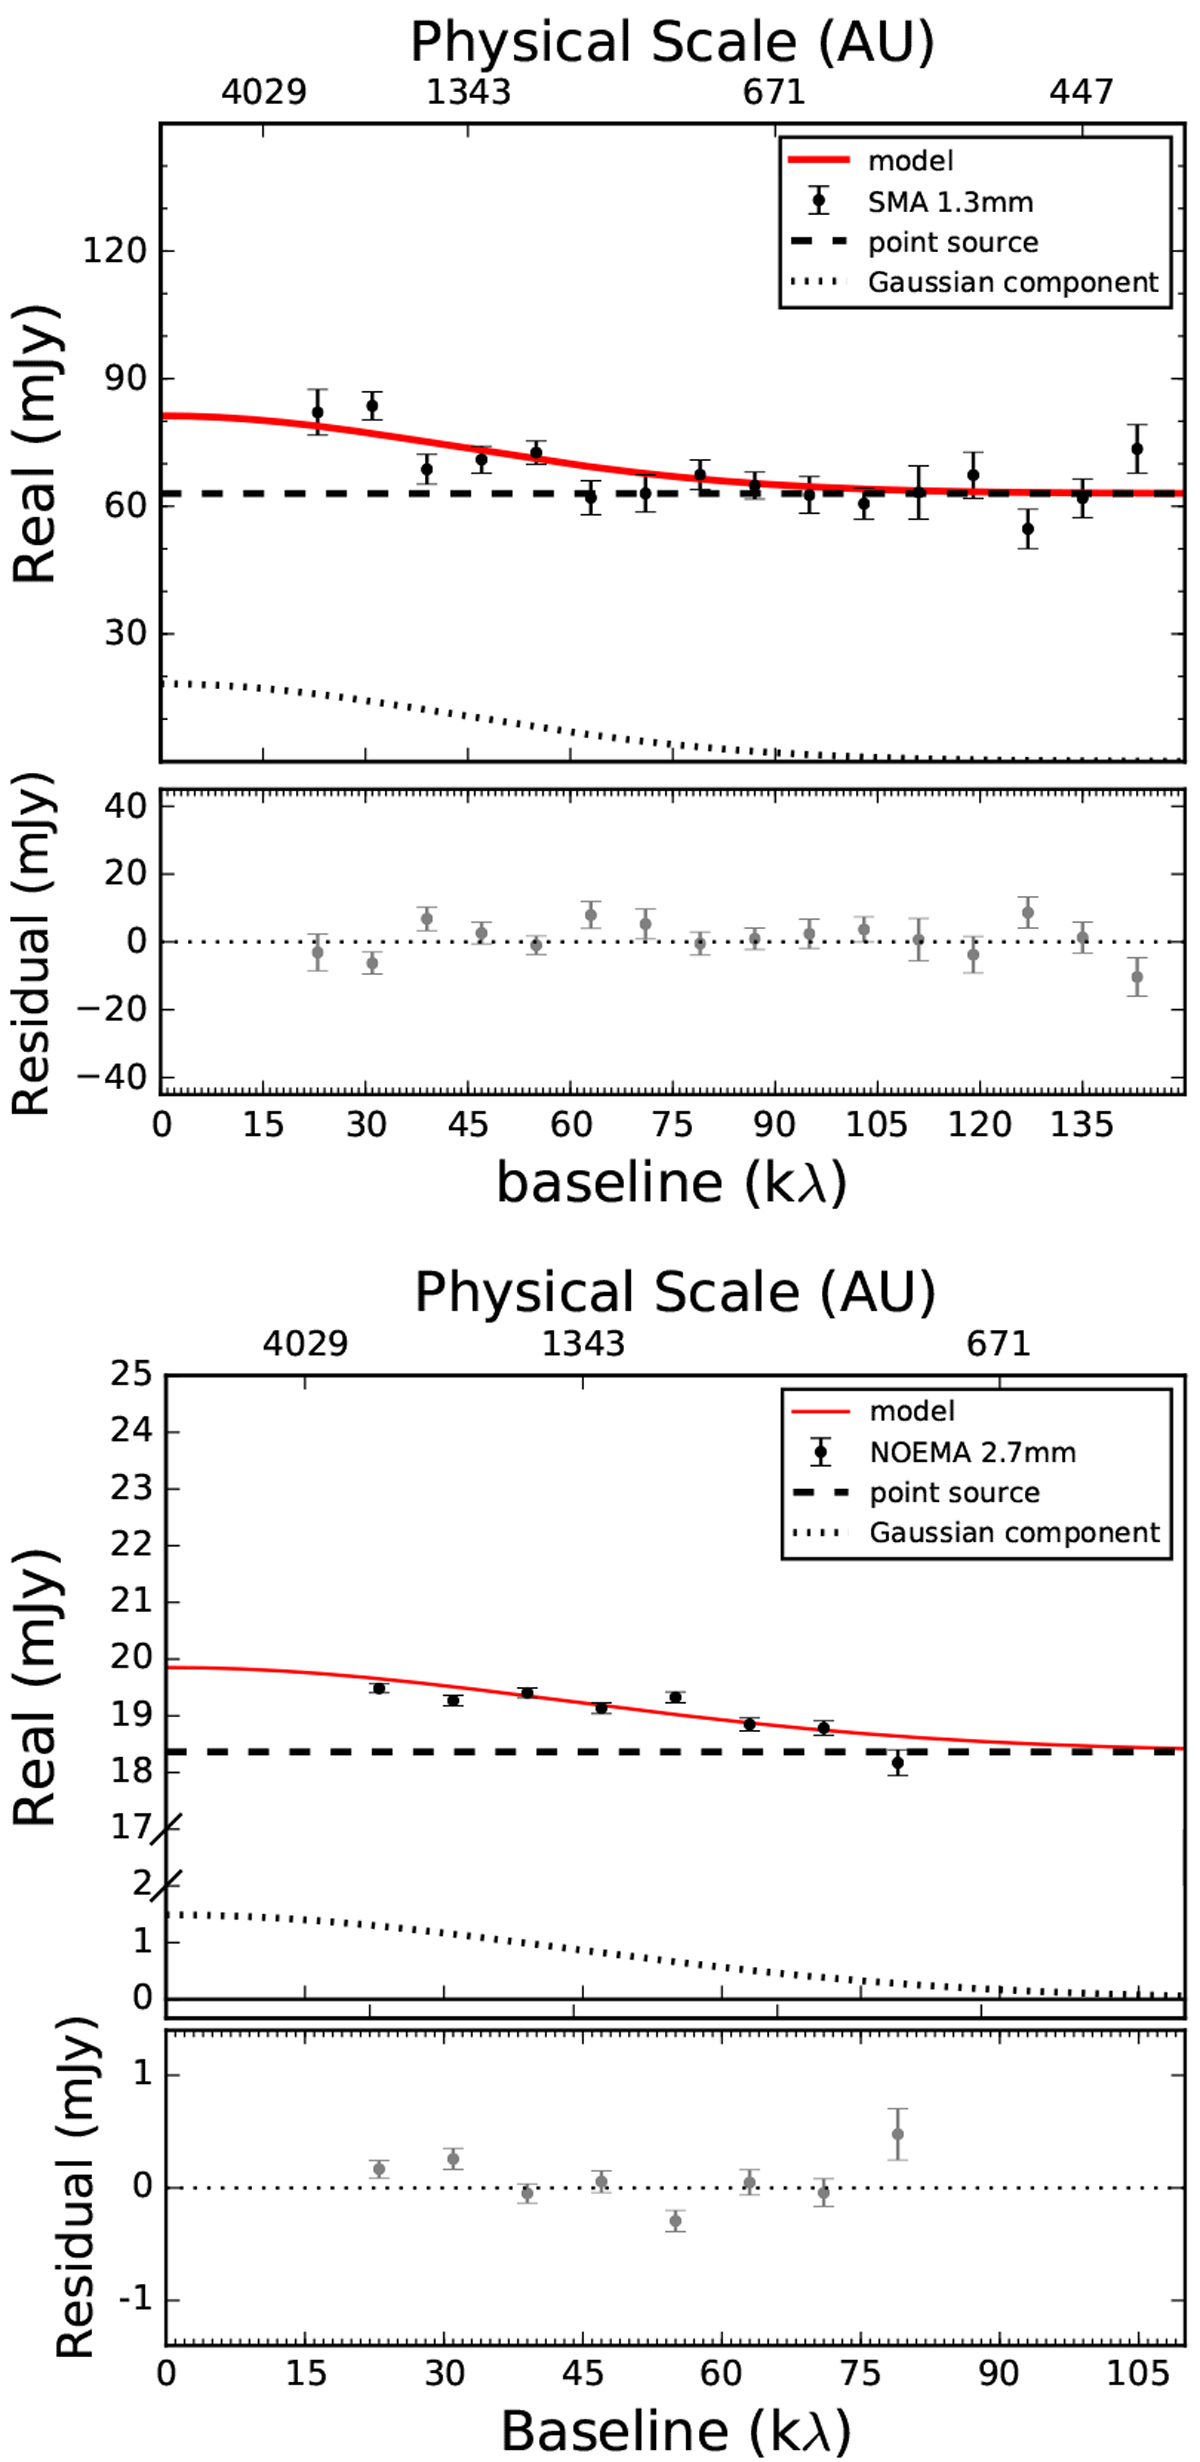
Black points are the real part of the visibilities as a function of the baseline length. Red curves show the best-fit model, whilethe dashed and dotted lines indicate its point source and Gaussian components, respectively. Bottom panels: residual between the model and data.
Current usage metrics show cumulative count of Article Views (full-text article views including HTML views, PDF and ePub downloads, according to the available data) and Abstracts Views on Vision4Press platform.
Data correspond to usage on the plateform after 2015. The current usage metrics is available 48-96 hours after online publication and is updated daily on week days.
Initial download of the metrics may take a while.