Open Access
Fig. 3
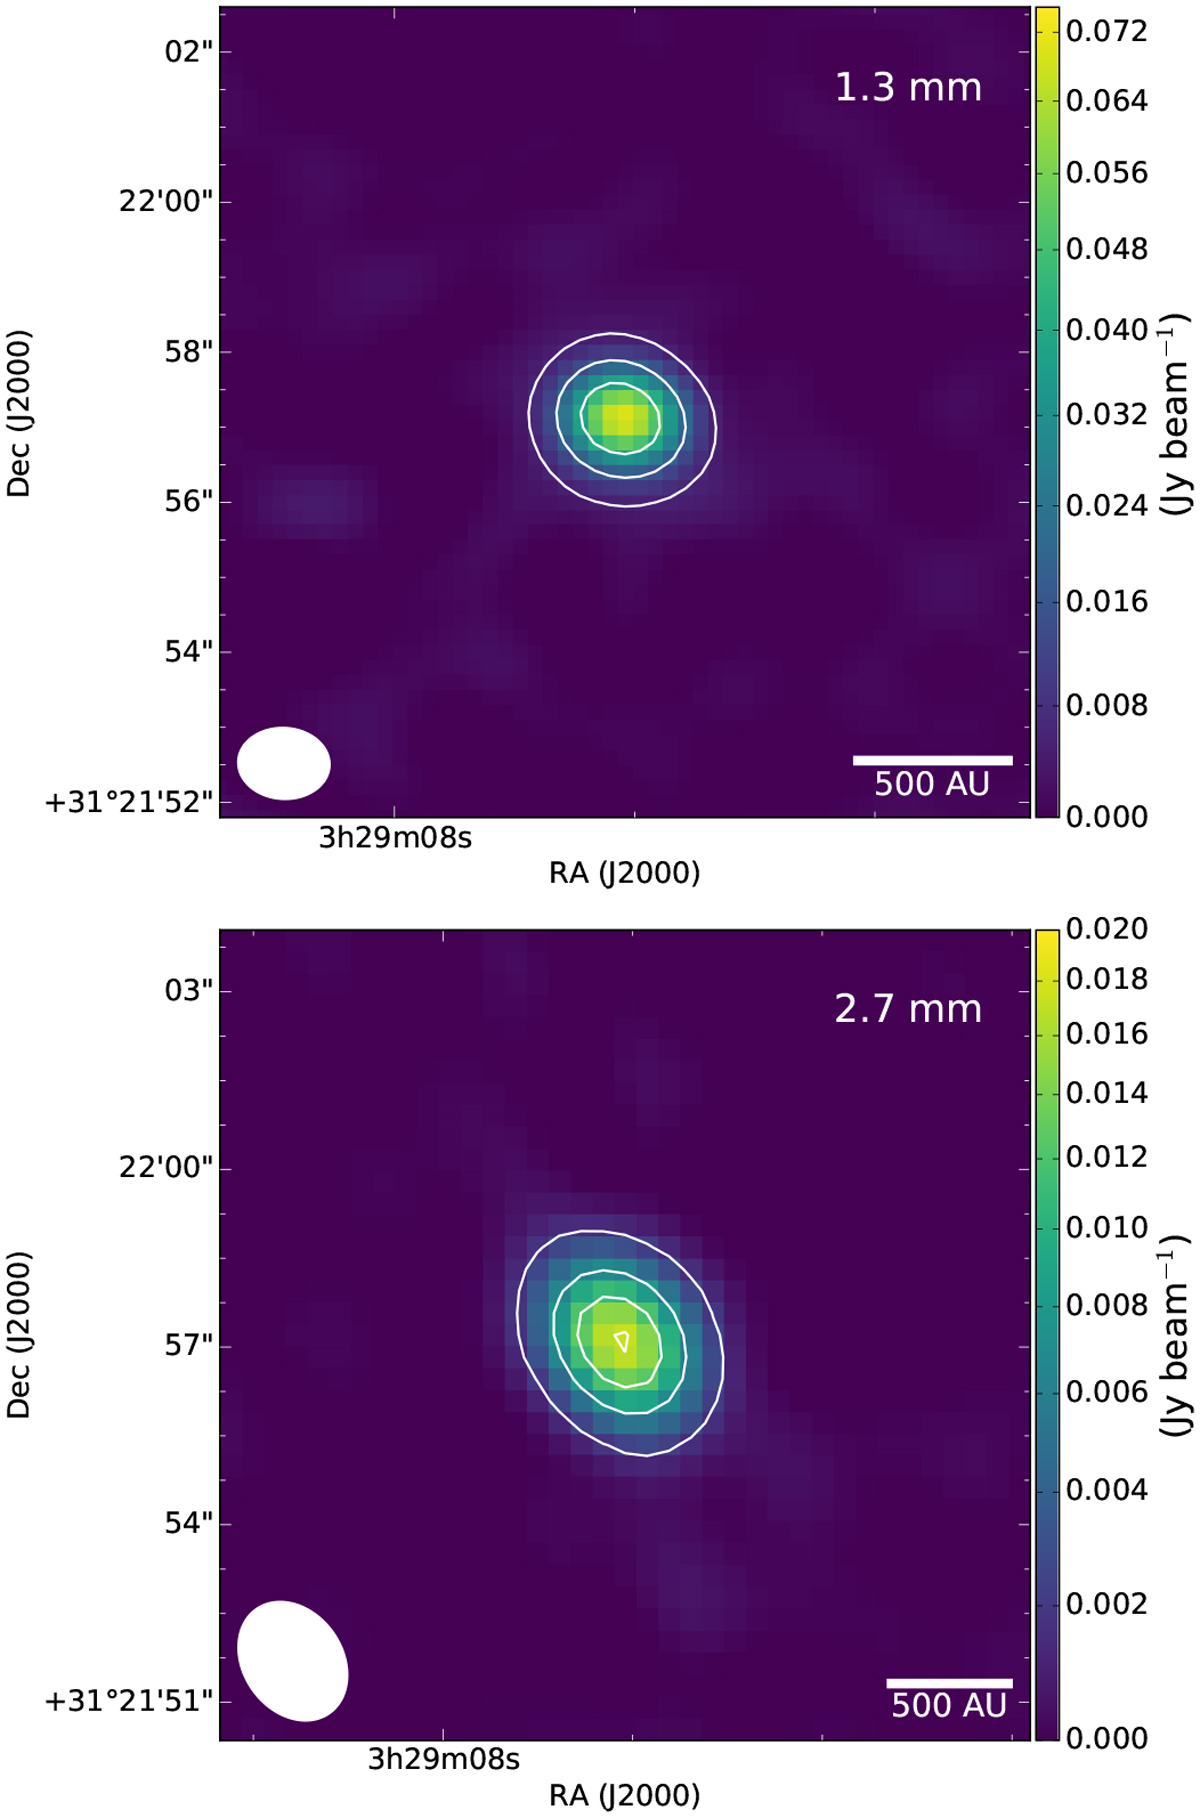
Continuum map of Per-emb-50 at 1.3 mm (SMA) and 2.7 mm (NOEMA) wavelengths. The synthesized beam FWHM is represented as a white ellipse in the bottom-left corner of each map. For SMA and NOEMA data, the contours start at 76 and 20 mJy beam−1, respectively, and both increase in 25% intervals.
Current usage metrics show cumulative count of Article Views (full-text article views including HTML views, PDF and ePub downloads, according to the available data) and Abstracts Views on Vision4Press platform.
Data correspond to usage on the plateform after 2015. The current usage metrics is available 48-96 hours after online publication and is updated daily on week days.
Initial download of the metrics may take a while.