Fig. 2
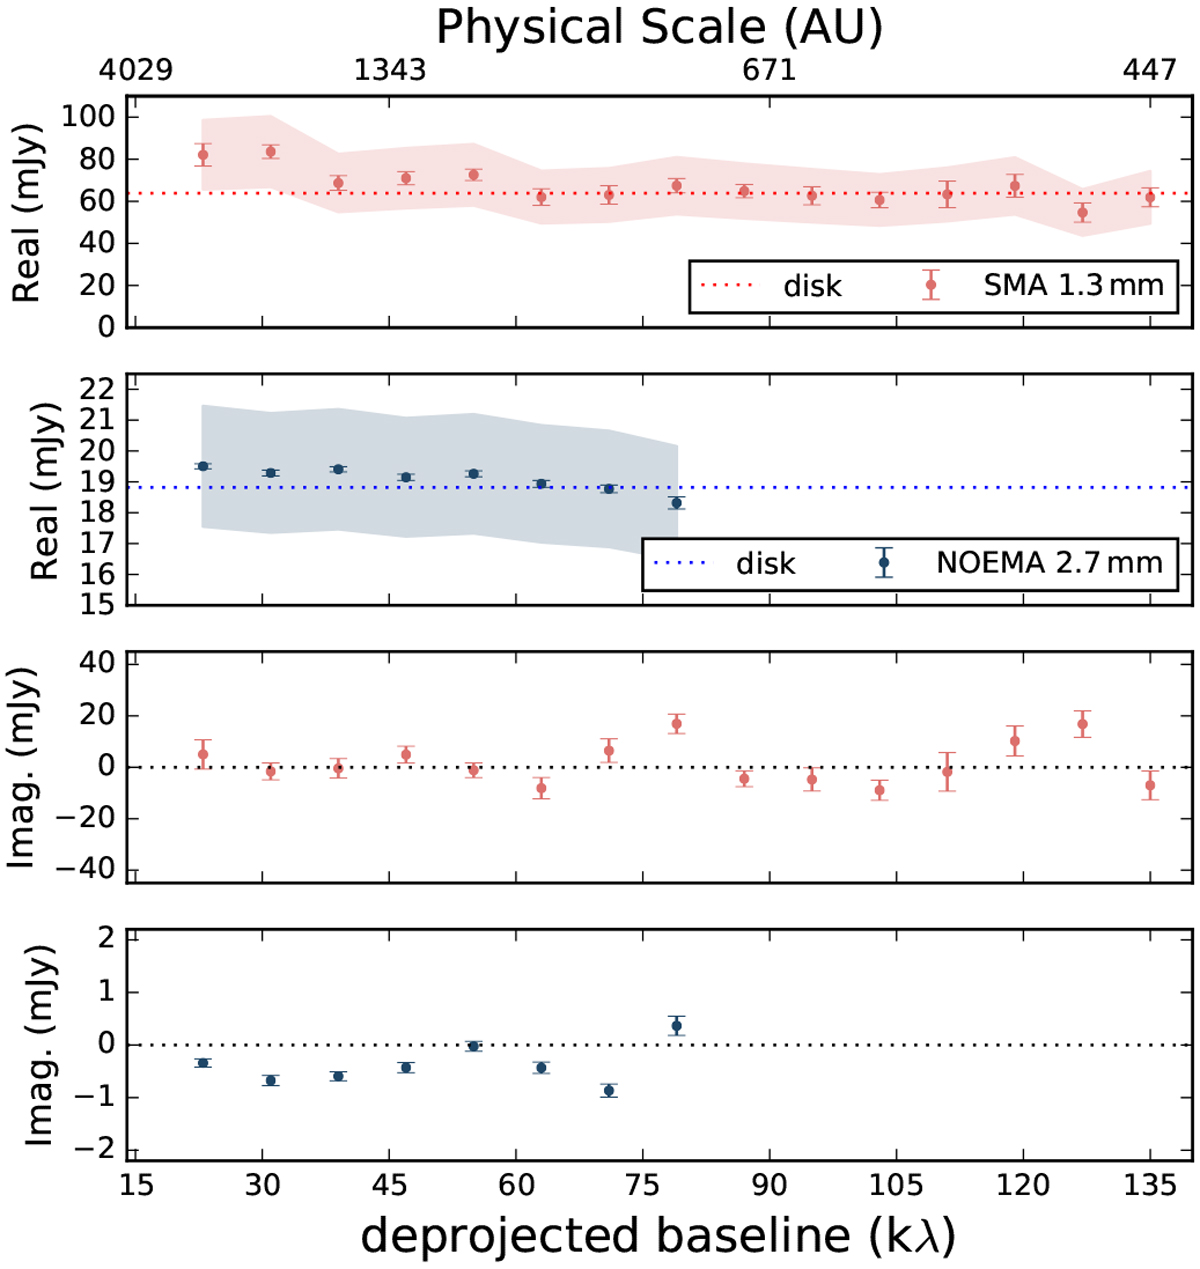
Real and imaginary parts of the measured visibilities of Per-emb-50 as a function of the deprojected baseline, assuming the PA and i from Table 1. The data are averaged in 8 kλ bins. The error bars in the real parts show the statistical standard errors of visibilities in each bin. Red and blue shaded areas show the 20 and 10% flux calibration uncertainties of the SMA and NOEMA data, respectively. Red and blue dashed lines are the disk average fluxes using baselines larger than 47 kλ.
Current usage metrics show cumulative count of Article Views (full-text article views including HTML views, PDF and ePub downloads, according to the available data) and Abstracts Views on Vision4Press platform.
Data correspond to usage on the plateform after 2015. The current usage metrics is available 48-96 hours after online publication and is updated daily on week days.
Initial download of the metrics may take a while.