Open Access
Fig. C.1
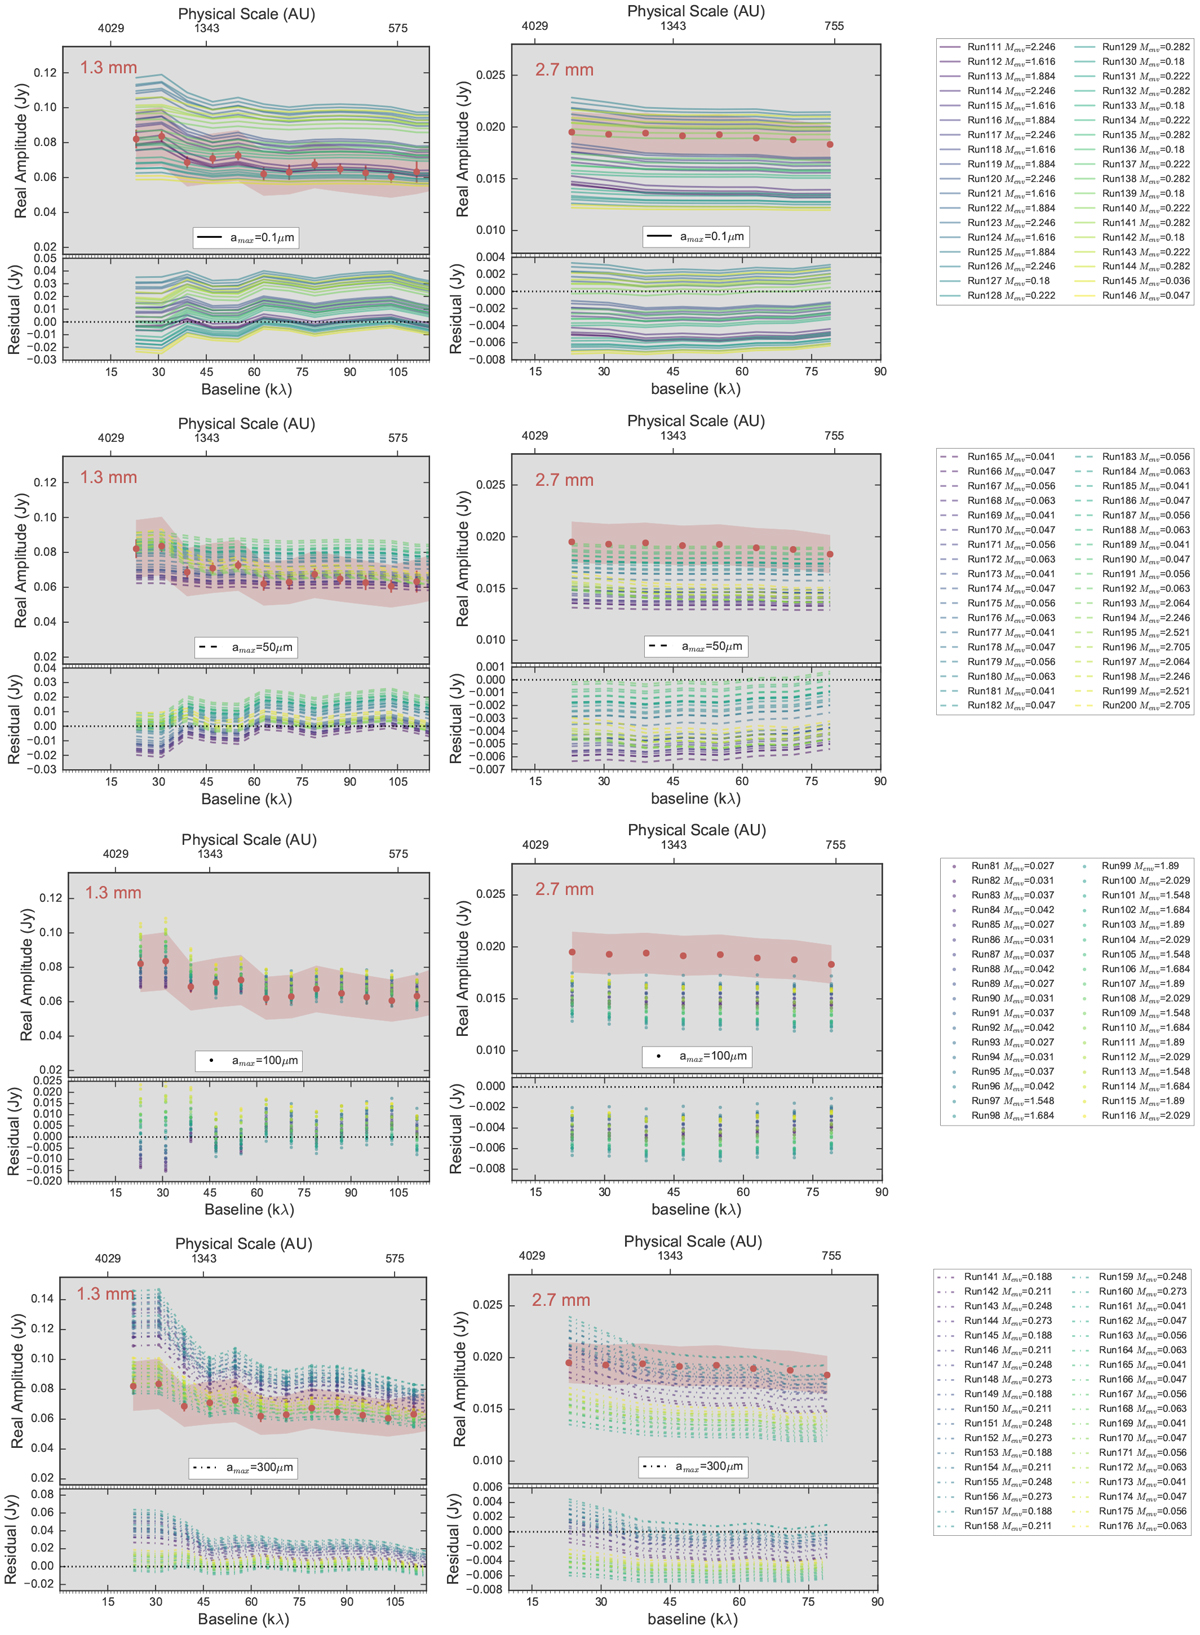
Fullradiative-transfer models for different amax. The name of the model and derived envelope mass are in the right panels. The color gradient represents the χ2 from low (blue) to high values (yellow), that were used only as reference. After visual inspection, we chose the best models fromthe green area.
Current usage metrics show cumulative count of Article Views (full-text article views including HTML views, PDF and ePub downloads, according to the available data) and Abstracts Views on Vision4Press platform.
Data correspond to usage on the plateform after 2015. The current usage metrics is available 48-96 hours after online publication and is updated daily on week days.
Initial download of the metrics may take a while.