Open Access
Fig. 1
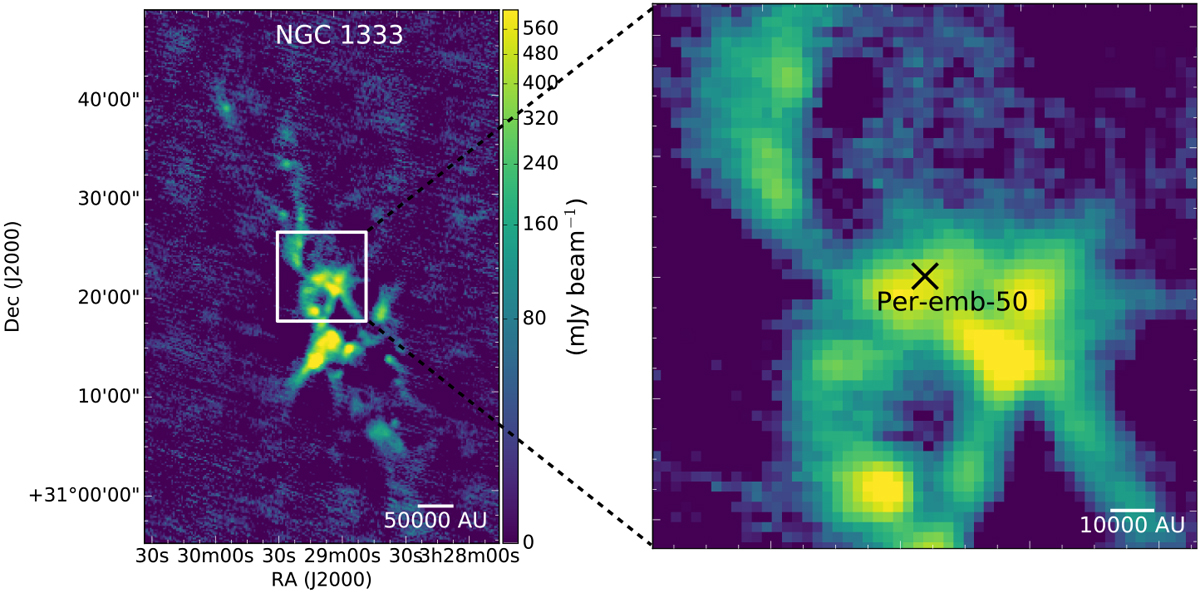
Left panel: continuum map of the NGC1333 complex at 1.1 mm wavelength. Right panel: zoom-in to the direct environment of Per-emb-50. The map is adapted from the Bolocam survey at the Caltech Submillimeter Observatory (CSO) by Enoch et al. (2006).
Current usage metrics show cumulative count of Article Views (full-text article views including HTML views, PDF and ePub downloads, according to the available data) and Abstracts Views on Vision4Press platform.
Data correspond to usage on the plateform after 2015. The current usage metrics is available 48-96 hours after online publication and is updated daily on week days.
Initial download of the metrics may take a while.