Fig. 2
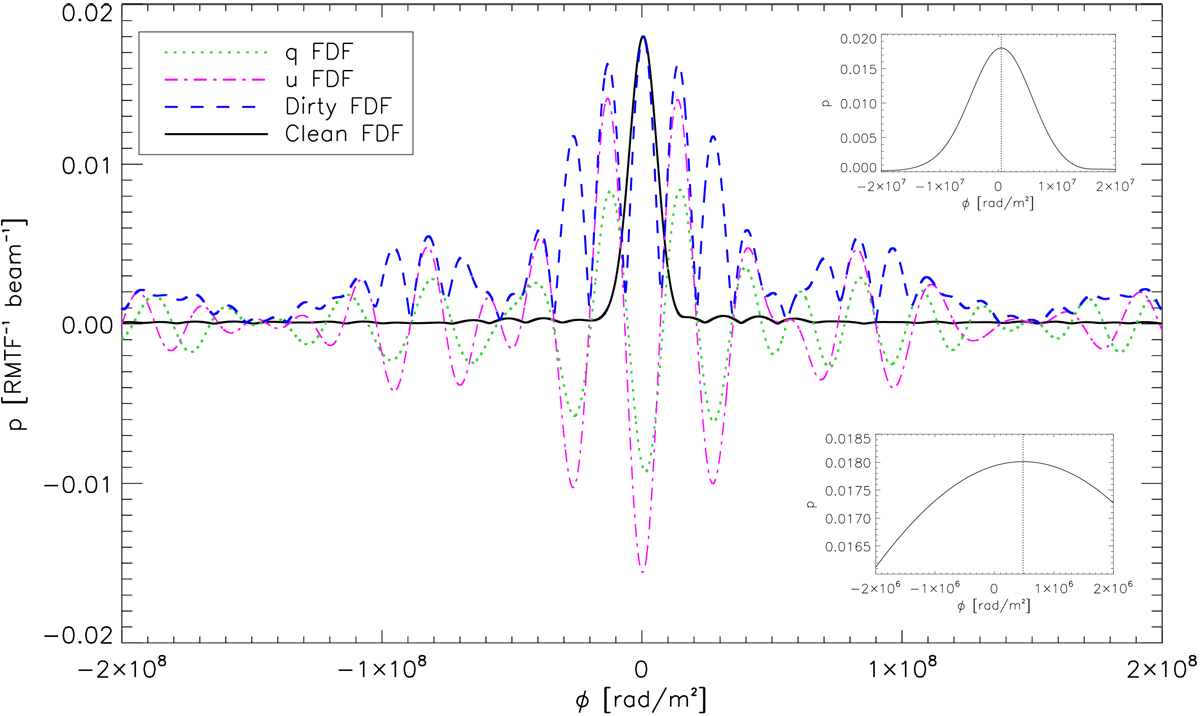
Amplitude of the Faraday dispersion function (FDF) after applying RM synthesis. The Faraday depth (ϕ) varies from − 2 × 10⁸ to + 2 ×10⁸ rad m−2 sampled at intervals of 104 rad m−2. The dirty FDFs are shown for q = Q∕I (green dotted line), u = U∕I (magenta dot-dashed line), and p (blue dashed line); the FDF after applying RM CLEAN is also shown (solid black line). The inset panel in the top right is a zoom-inof the main lobe of the FDF, while the bottom right is further zoomed-in to highlight the non-zero Faraday depth of the peak polarized emission (vertical dotted line in both cases).
Current usage metrics show cumulative count of Article Views (full-text article views including HTML views, PDF and ePub downloads, according to the available data) and Abstracts Views on Vision4Press platform.
Data correspond to usage on the plateform after 2015. The current usage metrics is available 48-96 hours after online publication and is updated daily on week days.
Initial download of the metrics may take a while.