| Issue |
A&A
Volume 622, February 2019
|
|
|---|---|---|
| Article Number | A167 | |
| Number of page(s) | 7 | |
| Section | Atomic, molecular, and nuclear data | |
| DOI | https://doi.org/10.1051/0004-6361/201834696 | |
| Published online | 15 February 2019 | |
Theoretical investigation of energy levels and transition data for P II⋆
1
Institute of Theoretical Physics and Astronomy, Vilnius University, Saulėtekio av. 3, 10222 Vilnius, Lithuania
e-mail: This email address is being protected from spambots. You need JavaScript enabled to view it.
2
Group for Materials Science and Applied Mathematics, Malmö University, 20506 Malmö, Sweden
Received:
21
November
2018
Accepted:
2
January
2019
Abstract
Aims. The main goal of this paper is to present accurate and extensive transition data for the P II ion. These data are useful in various astrophysical applications.
Methods. The multiconfiguration Dirac–Hartree–Fock (MCDHF) and relativistic configuration interaction (RCI) methods, which are implemented in the general-purpose relativistic atomic structure package GRASP2K, were used in the present work. In the RCI calculations the transverse-photon (Breit) interaction, the vacuum polarization, and the self-energy corrections were included.
Results. Energy spectra are presented for 48 even states of the 3s23p2, 3s23p{4p, 4f, 5p, 5f, 6p}, 3s3p23d configurations, and for 58 odd states of the 3s3p3, 3s23p{3d, 4s, 4d, 5s, 5d, 6s} configurations in the P II ion. Electric dipole (E1) transition data are computed between these states along with the corresponding lifetimes. The average uncertainty of the computed transition energies is between five and ten times smaller than the uncertainties from previous calculations. The computed lifetimes for the 3s23p4s3Po states are within the error bars of the most current experimental values.
Key words: atomic data / radiative transfer
Table 5 is only available at the CDS via anonymous ftp to cdsarc.u-strasbg.fr ( 130.79.128.5 ) or via http://cdsarc.u-strasbg.fr/viz-bin/qcat?J/A+A/622/A167
© ESO 2019
1. Introduction
P II is the dominant ion of the ionized phosphorus elements in the neutral interstellar medium. Singly ionized phosphorus has one of the strongest transitions at 1153 Å (3s23p23P – 3s23p4s 3Po) which is typically used to derive phosphorus abundances (Federman et al. 2007). Accurate transition data of P II are useful in astrophysical environments; they are important for the determination of column densities and velocity structure of the interstellar and intergalactic matter (Tayal 2003).
Hibbert (1988) used configuration interaction as implemented in the CIV3 code to compute energy spectra and probabilities of electric dipole transitions. Tayal (2003) used the multiconfiguration Hartree–Fock (MCHF) method including relativistic corrections through the Breit–Pauli Hamiltonian to calculate energy spectra and transition data for allowed and intercombination lines. Fischer et al. (2006) computed energy levels of the 3s23p2, 3s3p3, 3s23p3d, 3s23p4s, and 3s23p4p configurations and transition data using MCHF with the Breit–Pauli approximation for including relativistic corrections. El-Maaref et al. (2012) calculated energy levels, and transition data of silicon-like ions P II, S III, Cl IV, Ar V, and K VI using CIV3. Cashman et al. (2017) compiled the atomic data that are of interest for astrophysics, focusing on the transitions of those ions that have been observed in the Milky Way interstellar medium and/or other galaxies.
Miller et al. (1971) presented the absolute transition probabilities of P I and P II lines measured using the shock-tube technique. Svendenius et al. (1983) measured lines of the P II spectrum in the wavelength region 500–12 000 Å. Federman et al. (2007) presented beam-foil measurements of lifetimes, oscillator strengths, and branching fractions for the multiplet (3s23p23P – 3s23p4s 3Po) transitions at 1154 Å.
In this work energy spectrum calculations were performed for 48 even states of the 3s23p2, 3s23p4p, 3s23p4f, 3s23p5p, 3s23p5f, 3s23p6p, and 3s3p23d configurations, and for 58 odd states of the 3s3p3, 3s23p3d, 3s23p4s, 3s23p4d, 3s23p5s, 3s23p5d, and 3s23p6s configurations in P II. Furthermore, electric dipole (E1) transition data were computed between these states.
The calculations were done using multiconfiguration Dirac–Hartree–Fock (MCDHF) and relativistic configuration interaction (RCI) methods (Grant 2007; Fischer et al. 2016), which are implemented in the general-purpose relativistic atomic structure package GRASP2K (Jönsson et al. 2013). In the RCI calculations the transverse-photon (Breit) interaction, the vacuum polarization, and the self-energy corrections were included.
2. Methods
2.1. Computational procedure
The MCDHF method used in the present work is based on the Dirac-Coulomb Hamiltonian
 (1)
(1)
where VN is the monopole part of the electron–nucleus Coulomb interaction, α and β are the 4 × 4 Dirac matrices, and c is the speed of light in atomic units. The atomic state functions (ASFs) were obtained as linear combinations of symmetry adapted configuration state functions (CSFs)
 (2)
(2)
Here J and M are the angular quantum numbers and P is parity. γi denotes other appropriate labeling of the configuration state function i, for example orbital occupancy and coupling scheme. Normally the label γ of the atomic state function is the same as the label of the dominating CSF. The CSFs are built from products of one-electron Dirac orbitals. Based on a weighted energy average of several states, the so-called extended optimal level (EOL) scheme (Dyall et al. 1989), both the radial parts of the Dirac orbitals, and the expansion coefficients were optimized to self-consistency in the relativistic self-consistent field procedure.
In subsequent RCI calculations the transverse photon interaction (Breit interaction),
![Mathematical equation: $$ \begin{aligned}&H_{\text{ Breit}} = - \mathop \sum \limits _{i < j}^N \left[ {\boldsymbol{\alpha }}_{i} \cdot {\boldsymbol{\alpha }}_{j}\frac{ \cos (\omega _{ij} r_{ij}/c)}{r_{ij}} \right. \nonumber \\&\qquad \quad + \left. ({\boldsymbol{\alpha }}_{i} \cdot {\boldsymbol{\nabla }}_i ) ({\boldsymbol{\alpha }}_{j} \cdot {\boldsymbol{\nabla }}_j )\frac{ \cos (\omega _{ij}r_{ij}/c) -1}{\omega _{ij}^2 r_{ij}/c^2} \right] ,\end{aligned} $$](/articles/aa/full_html/2019/02/aa34696-18/aa34696-18-eq3.gif) (3)
(3)
was included in the Hamiltonian. The photon frequencies ωij, used for calculating the matrix elements of the transverse photon interaction, were taken as the difference of the diagonal Lagrange multipliers associated with the Dirac orbitals (McKenzie et al. 1980). In the RCI calculation the leading quantum electrodynamics corrections (QED), self-interaction and vacuum polarization, were also included.
In the present calculations, the ASFs were obtained as expansions over jj-coupled CSFs. To provide the LSJ labeling system, the ASFs were transformed from a jj-coupled CSF basis into an LSJ-coupled CSF basis using the method provided by Gaigalas et al. (2003, 2017).
2.2. Computation of transition parameters
The transition data (transition probabilities, oscillator strengths) between two states γ′P′J′M′ and γPJM can be expressed in terms of the transition moment, which is defined as
 (4)
(4)
where T is the transition operator. For electric dipole and quadrupole (E1 and E2) transitions there are two forms of the transition operator: the length (Babushkin) and velocity (Coulomb) forms, which for the exact solutions of the Dirac-equation give the same value of the transition moment (Grant 1974). The quantity dT, characterizing the uncertainty of the computed transition rates, is defined as
 (5)
(5)
where Al and Av are transition rates in length and velocity forms.
The calculation of the transition moment breaks down to the task of summing up reduced matrix elements between different CSFs.
3. Scheme of calculations
As a starting point, MCDHF calculations were performed in the extended optimal level scheme for the weighted average of the even and odd parity states simultaneously. The ASFs were constructed using the multireference-single-double (MR-SD) method (Fischer et al. 2016). The MR sets for the even and odd parities are presented in the Table 1, which also displays the number of CSFs in the final even and odd state expansions distributed over the different J symmetries.
Summary of active space construction.
The CSF expansions were obtained by allowing SD substitutions from the configurations in the MR to active orbital sets {12s, 11p, 11d, 10f, 9g, 7h, 7i}. Only CSFs that have nonzero matrix elements with the CSFs belonging to the configurations in the MR were retained. No substitutions were allowed from the 1s, 2s, 2p shells, which defines an inactive closed core. The MCDHF calculations were followed by RCI calculations, done separately for even and odd states. At the last step, MR was extended and core-valence (CV) correlation (the single substitutions from 2p shell was allowed) was included in the RCI calculations. Single substitutions from 2p shell were allowed to active orbital sets {9s, 8p, 8d, 7f, 6g}.
4. Results
In the present work, energy spectra are presented for the 106 (48 even, and 58 odd) lowest states in P II.
To evaluate the accuracy, the obtained transition energies are compared with results from the NIST (Kramida et al. 2018) database, and other theoretical computations (Fig. 1). The figure also shows the contributions from core-valence electron correlations and extensions of the MR sets in the present calculations. The final result (RCI (CV)) for the energy spectra agrees very well with NIST. The disagreement is up to 0.15%, except for a few less-excited states where it reaches 1.5%. The averaged uncertainty of computed energy spectra comparing with NIST data is 0.19%. Comparing with other calculations it is seen from Fig. 1 that the results of Fischer et al. (2006) also agree well with the NIST, but the authors calculated less energy levels (41 levels). In Fischer et al. (2006) the largest disagreement is by about 13% for  states (these points were not included in the Fig. 1). In Table 2 a summary of previous calculations is presented: namely, the number of computed energy levels (No. of levels in Ref.) and the average percentage difference between NIST and the different methods for the states covered by these methods (Av. accuracy). Final results (RCI (CV)) of energy spectra and lifetimes in length and velocity forms obtained from E1 transitions are displayed in Table A.1. In the present work states of 3s3p23d and 3s23p6p configurations are presented for the first time.
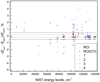 |
Fig. 1. Comparison of computed energy levels in present work and other theoretical results with data from NIST database. The dashed and solid lines indicate the 0.2% and 0.5% deviations, respectively. (1) Hibbert (1988); (2) Tayal (2003); (3) Fischer et al. (2006); (4) El-Maaref et al. (2012). |
Comparison of computed energy levels in present work and other theoretical results with data from NIST database.
Lifetimes for 3s23p4s 3Po states are compared with experiment and other theoretical calculations in Table 3. Computed lifetimes are within the uncertainties of experimental measurement.
Comparison of computed lifetimes (in ns) for 3s23p4s3Po states of P II ion.
Transition data such as wavelengths, weighted oscillator strengths, transition rates of E1 transitions and the accuracy indicator dT are given in Table 5, available at the CDS. Generally, the uncertainty of transition data is small for the stronger transitions. To display this, a scatterplot of dT vs. the transition rate A for computed E1 transitions (with A > 1000 s−1) is given in Fig. 2. For most of the strongest transitions, dT is well below 2%. The mean dT for all presented transitions is 7.83%. Table 4 displays the comparison of the theoretical and experimental results of wavelengths and oscillator strengths for the  transition. From the table we see that there is very good agreement between wavelengths and oscillator strengths computed in this work and the experimental values (Federman et al. 2007).
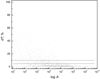 |
Fig. 2. Scatterplot of dT: the relative difference between the transition rates in length and velocity form vs. the transition rate A for P II. The solid lines indicate the 5% and 10% deviations. |
Comparison of wavelengths and oscillator strengths for the  transitions in P II.
5. Conclusions
In the present work energy spectra are computed for the 106 lowest states in P II using MCDHF and RCI methods. The mean uncertainty of calculated energy levels comparing with NIST data is 0.19%. The states of 3s3p23d and 3s23p6p configurations are presented for the first time.
Transition data for E1 transitions between computed states are presented. For most of the strongest transitions, dT is well below 2%. Lifetimes obtained from E1 transitions are also presented.
Acknowledgments
This research was funded by a grant (No. S-LJB- 18-1) from the Research Council of Lithuania.
References
- Brage, T., Merkelis, G., & Fischer, C. F. 1993, Phys. Lett. A, 174, 111 [NASA ADS] [CrossRef] [Google Scholar]
- Cashman, F. H., Kulkarni, V. P., Kisielius, R., Ferland, G. J., & Bogdanovich, P. 2017, ApJS, 230, 8 [NASA ADS] [CrossRef] [Google Scholar]
- Dyall, K., Grant, I., Johnson, C., Parpia, F., & Plummer, E. 1989, Comput. Phys. Commun., 55, 425 [NASA ADS] [CrossRef] [Google Scholar]
- El-Maaref, A. A., Uosif, M., Allam, S., & El-Sherbini, T. 2012, At. Data Nucl. Data Tab., 98, 589 [NASA ADS] [CrossRef] [Google Scholar]
- Federman, S. R., Brown, M., Torok, S., et al. 2007, ApJ, 660, 919 [NASA ADS] [CrossRef] [Google Scholar]
- Fischer, C. F., Tachiev, G., & Irimia, A. 2006, At. Data Nucl. Data Tab., 92, 607 [NASA ADS] [CrossRef] [Google Scholar]
- Fischer, C. F., Godefroid, M., Brage, T., Jönsson, P., & Gaigalas, G. 2016, J. Phys. B At. Mol. Opt. Phys., 49, 182004 [Google Scholar]
- Gaigalas, G., Žalandauskas, T., & Rudzikas, Z. 2003, At. Data Nucl. Data Tab., 84, 99 [NASA ADS] [CrossRef] [Google Scholar]
- Gaigalas, G., Fischer, C., Rynkun, P., & Jönsson, P. 2017, Atoms, 5, 6 [NASA ADS] [CrossRef] [Google Scholar]
- Grant, I. P. 1974, J. Phys. B At. Mol. Opt. Phys., 7, 1458 [Google Scholar]
- Grant, I. P. 2007, Relativistic Quantum Theory of Atoms and Molecules (New York: Springer) [CrossRef] [Google Scholar]
- Hibbert, A. 1988, Phys. Scr., 38, 37 [NASA ADS] [CrossRef] [Google Scholar]
- Jönsson, P., Gaigalas, G., Bieroń, J., Fischer, C. F., & Grant, I. 2013, Comput. Phys. Commun., 184, 2197 [NASA ADS] [CrossRef] [Google Scholar]
- Kramida, A., Ralchenko, Yu., Reader, J., & NIST ASD Team 2018, NIST Atomic Spectra Database (ver. 5.5.6), https://physics.nist.gov/asd, National Institute of Standards and Technology, Gaithersburg, MD [Google Scholar]
- Livingston, A. E., Kernahan, J. A., Irwin, D. J. G., & Pinnington, E. H. 1975, Phys. Scr., 12, 223 [NASA ADS] [CrossRef] [Google Scholar]
- McKenzie, B., Grant, I., & Norrington, P. 1980, Comput. Phys. Commun., 21, 233 [NASA ADS] [CrossRef] [Google Scholar]
- Miller, M. H., Roig, R. A., & Bengtson, R. D. 1971, Phys. Rev. A, 4, 1709 [NASA ADS] [CrossRef] [Google Scholar]
- Smith, W. H. 1978, Phys. Scr., 17, 513 [NASA ADS] [CrossRef] [Google Scholar]
- Svendenius, N., Magnusson, C. E., & Zetterberg, P. O. 1983, Phys. Scr., 27, 339 [NASA ADS] [CrossRef] [Google Scholar]
- Tayal, S. S. 2003, ApJS, 146, 459 [NASA ADS] [CrossRef] [Google Scholar]
Appendix A: Computed energy levels and lifetimes for the P II ion
Computed energy levels (in cm−1) and lifetimes (in s) in length and velocity gauges for the P II ion.
All Tables
Comparison of computed energy levels in present work and other theoretical results with data from NIST database.
Computed energy levels (in cm−1) and lifetimes (in s) in length and velocity gauges for the P II ion.
All Figures
|
Fig. 1. Comparison of computed energy levels in present work and other theoretical results with data from NIST database. The dashed and solid lines indicate the 0.2% and 0.5% deviations, respectively. (1) Hibbert (1988); (2) Tayal (2003); (3) Fischer et al. (2006); (4) El-Maaref et al. (2012). |
| In the text | |
|
Fig. 2. Scatterplot of dT: the relative difference between the transition rates in length and velocity form vs. the transition rate A for P II. The solid lines indicate the 5% and 10% deviations. |
| In the text | |
Current usage metrics show cumulative count of Article Views (full-text article views including HTML views, PDF and ePub downloads, according to the available data) and Abstracts Views on Vision4Press platform.
Data correspond to usage on the plateform after 2015. The current usage metrics is available 48-96 hours after online publication and is updated daily on week days.
Initial download of the metrics may take a while.