Fig. 25.
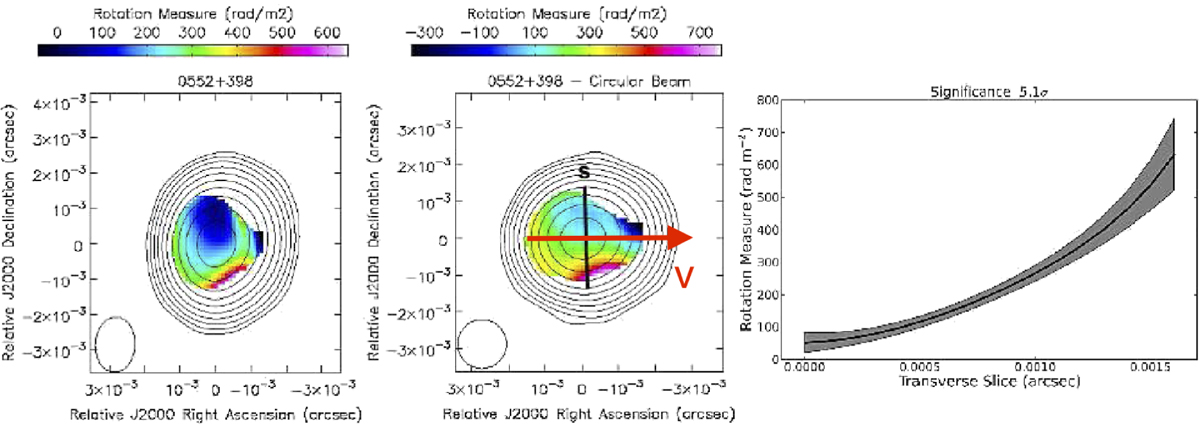
Radio emission contours (shown in black) and Faraday rotation measure of 0552+398, shown in colour. The left panel is with an elliptical beam (shown at bottom left), the middle panel with a circular beam and the Faraday Rotation measure is shown in the right panel. The projected velocity on the plane of the sky is shown with a red arrow at the middle panel and the slice along which the Faraday Rotation is measures is plotted as a black line in the middle panel. Figure reproduced by Gabuzda et al. (2018).
Current usage metrics show cumulative count of Article Views (full-text article views including HTML views, PDF and ePub downloads, according to the available data) and Abstracts Views on Vision4Press platform.
Data correspond to usage on the plateform after 2015. The current usage metrics is available 48-96 hours after online publication and is updated daily on week days.
Initial download of the metrics may take a while.