Fig. 1.
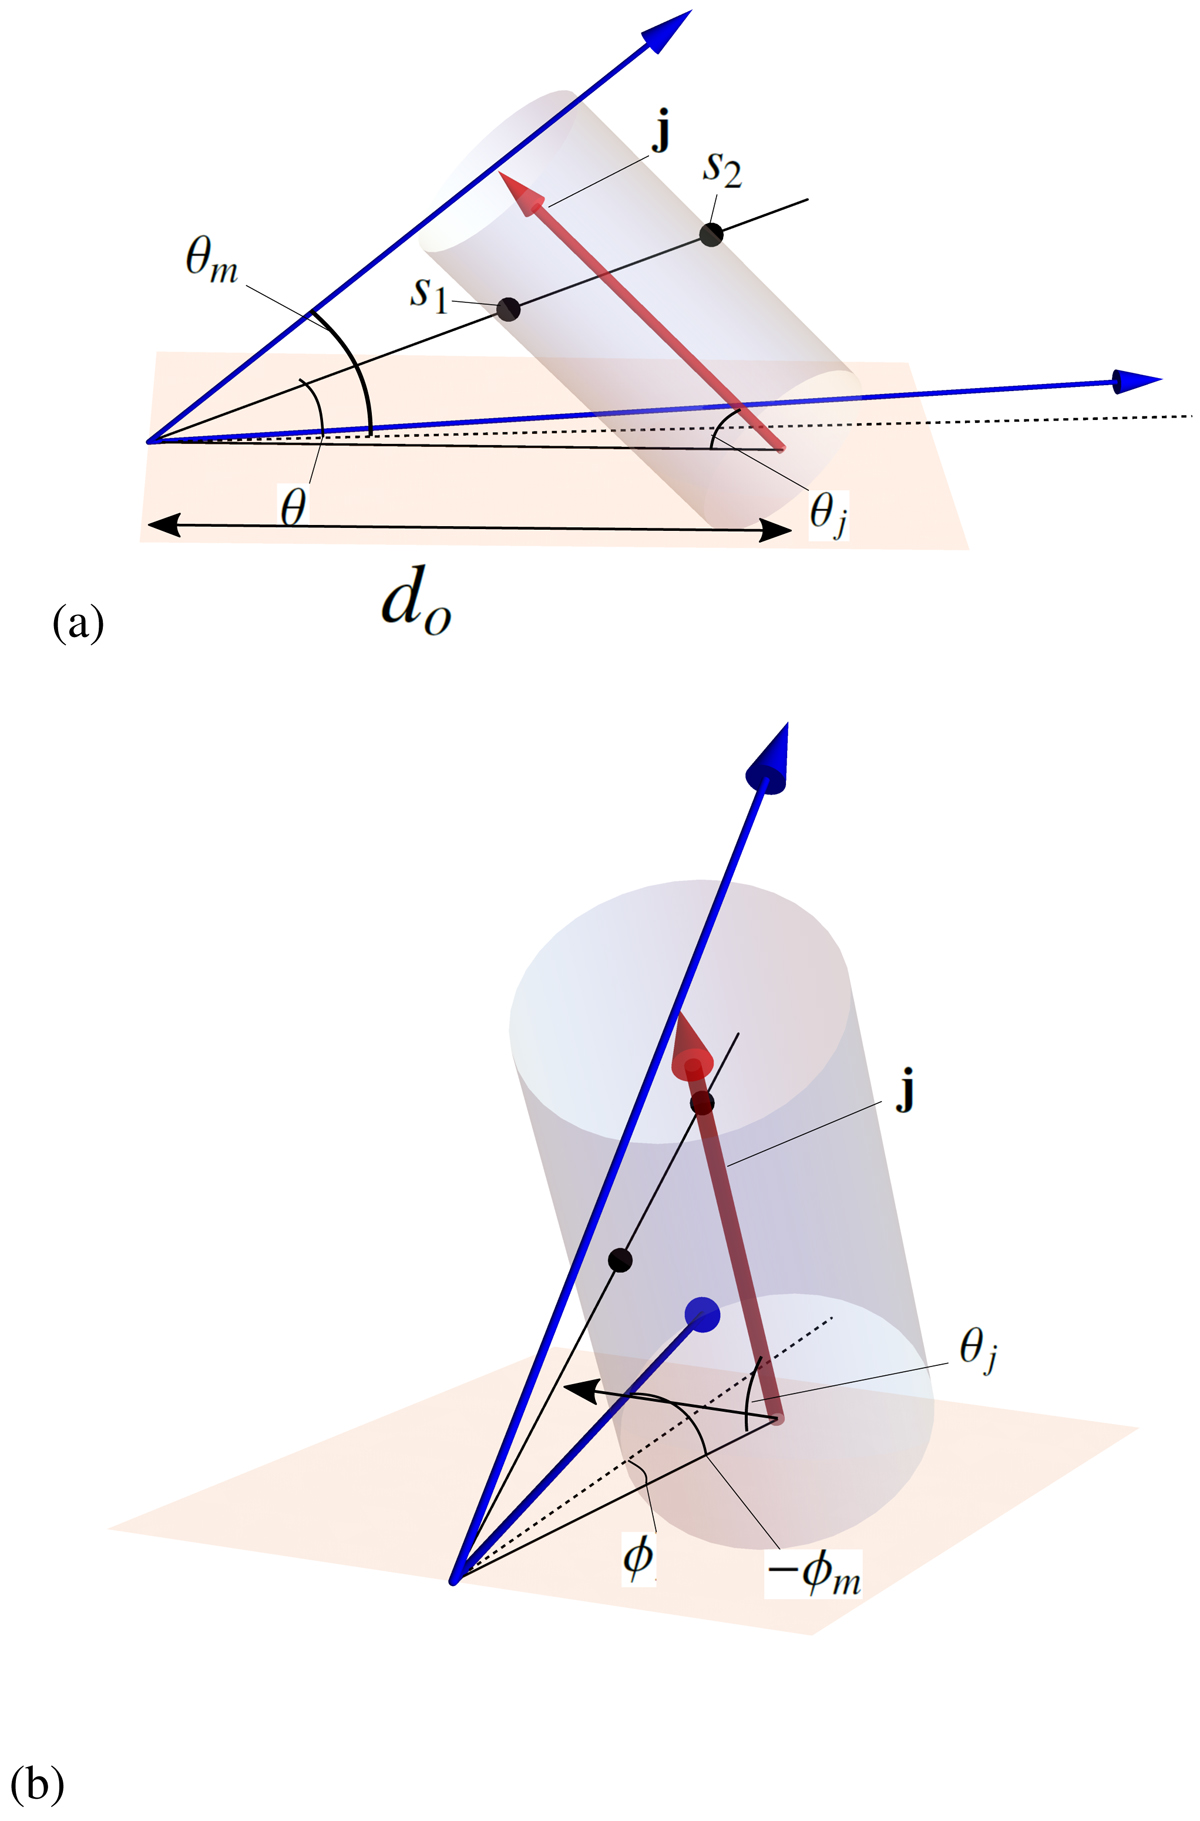
Representations of the model geometry. In panel a we see the model as viewed along the y-axis. In panel b the same figure is seen from “over the shoulder” of the observer. The jet direction J is shown as a red arrow, the jet angle θj this makes with the x-axis is also shown. The distance do from the observer to the jet along the x axis is shown. The Blue arrow skimming the jet’s upper surface indicates the maximum angle subtended by the jet to the viewer θm. A black line, representing the direction of photon observation, pierces the cylinder surface at s1 and s2 subtends an angle θ < θm. The second blue arrow indicates the maximum (in magnitude) ϕ angle −ϕm subtended by the viewer and the jet’s side edge, as indicated in panel b. Also shown in panel b as a dotted line is the projection of the photon observation direction into the x-y plane and the angle ϕ which indicates its off-set from the jet’s central axis.
Current usage metrics show cumulative count of Article Views (full-text article views including HTML views, PDF and ePub downloads, according to the available data) and Abstracts Views on Vision4Press platform.
Data correspond to usage on the plateform after 2015. The current usage metrics is available 48-96 hours after online publication and is updated daily on week days.
Initial download of the metrics may take a while.