Free Access
Fig. 3.
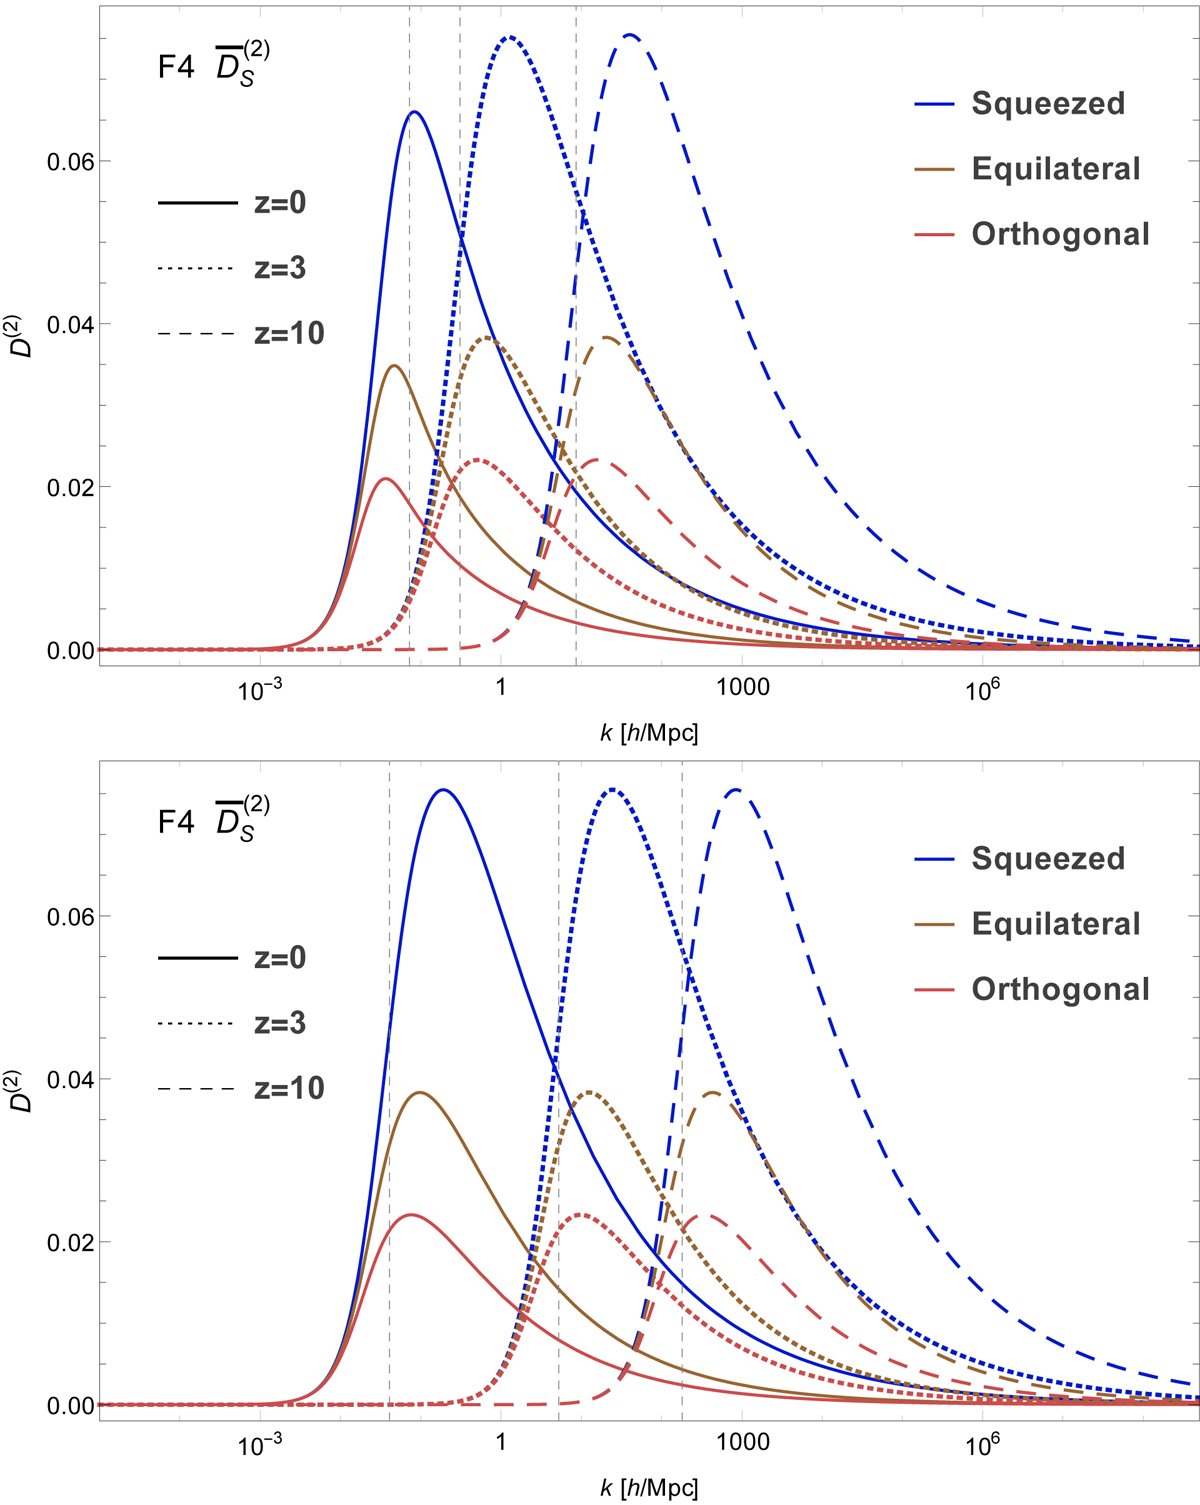
![]() functions for the F4 model for redshifts z = 0, 3, and10, and considering different triangle configurations. The vertical lines are located at
functions for the F4 model for redshifts z = 0, 3, and10, and considering different triangle configurations. The vertical lines are located at ![]() , showing the characteristic scale at which the screenings are present. The upper panel shows a ΛCDM background evolution, and the bottom panel presents an EdS background evolution.
, showing the characteristic scale at which the screenings are present. The upper panel shows a ΛCDM background evolution, and the bottom panel presents an EdS background evolution.
Current usage metrics show cumulative count of Article Views (full-text article views including HTML views, PDF and ePub downloads, according to the available data) and Abstracts Views on Vision4Press platform.
Data correspond to usage on the plateform after 2015. The current usage metrics is available 48-96 hours after online publication and is updated daily on week days.
Initial download of the metrics may take a while.