Fig. 7.
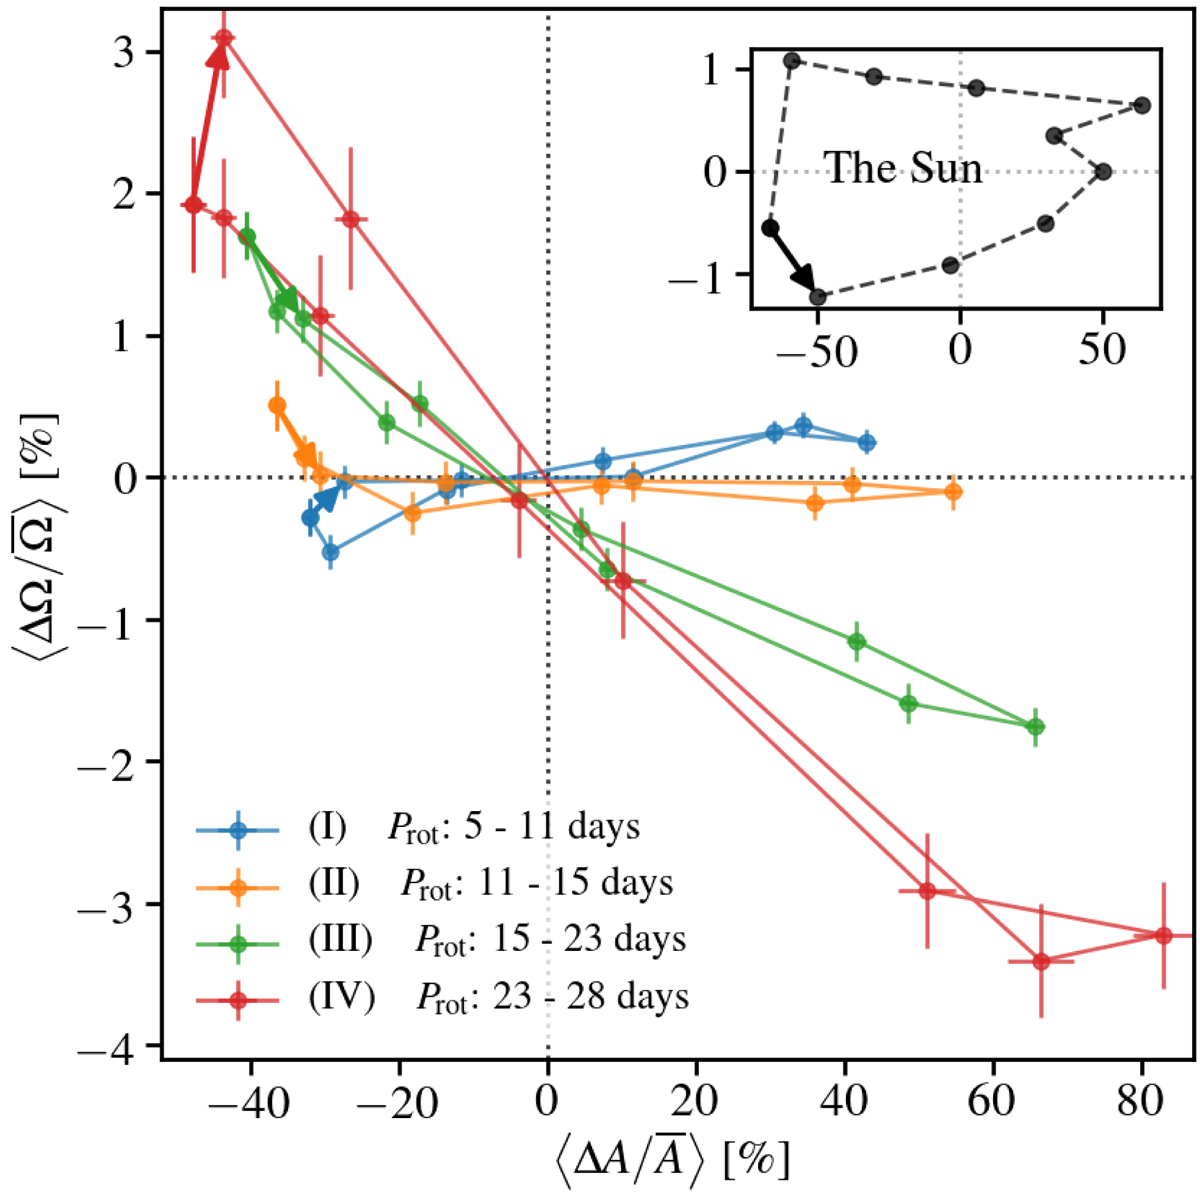
Relative difference in spot rotation rate, ![]() , as a function of ⟨ΔA(t)/A̅⟩ for the four period ranges of interest. For stars with Prot between five and 11 days (blue), only stars with Teff > 4200 K are shown for clarity. The inset shows the corresponding values for the Sun. Arrows denote the progression of the cycle phase, starting at activity minimum. Dotted lines indicate the position of the origin.
, as a function of ⟨ΔA(t)/A̅⟩ for the four period ranges of interest. For stars with Prot between five and 11 days (blue), only stars with Teff > 4200 K are shown for clarity. The inset shows the corresponding values for the Sun. Arrows denote the progression of the cycle phase, starting at activity minimum. Dotted lines indicate the position of the origin.
Current usage metrics show cumulative count of Article Views (full-text article views including HTML views, PDF and ePub downloads, according to the available data) and Abstracts Views on Vision4Press platform.
Data correspond to usage on the plateform after 2015. The current usage metrics is available 48-96 hours after online publication and is updated daily on week days.
Initial download of the metrics may take a while.