Fig. 6.
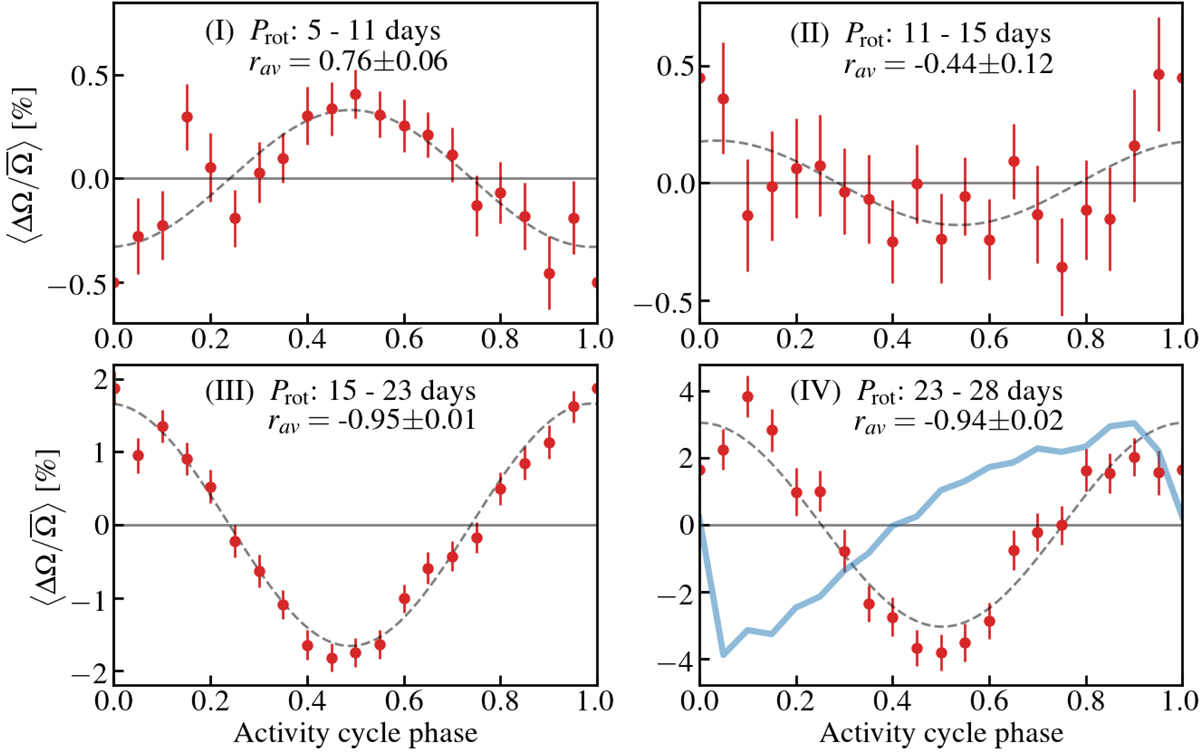
Averages of starspot rotation rates (red) over the stars in each sample I through IV. For clarity in frame I, we only show stars with Teff > 4200 K; stars cooler than this show similar anti-correlated behavior as slower rotators. In the remaining frames the entire sample in the respective period range is represented. In frame IV we also show in blue the variation of the sunspot rotation rate multiplied by a factor of 2.5 for comparison. By construction, the activity maximum occurs close to phase ϕ = 0.5 (see Fig. 4). The correlation, rav, between the ⟨ΔA(t)/A̅⟩ and ![]() of the stars is shown for each period range. The dashed curves are sinusoidal fits to the averages
of the stars is shown for each period range. The dashed curves are sinusoidal fits to the averages ![]() , whose parameters are provided in Table 1.
, whose parameters are provided in Table 1.
Current usage metrics show cumulative count of Article Views (full-text article views including HTML views, PDF and ePub downloads, according to the available data) and Abstracts Views on Vision4Press platform.
Data correspond to usage on the plateform after 2015. The current usage metrics is available 48-96 hours after online publication and is updated daily on week days.
Initial download of the metrics may take a while.