Fig. 5.
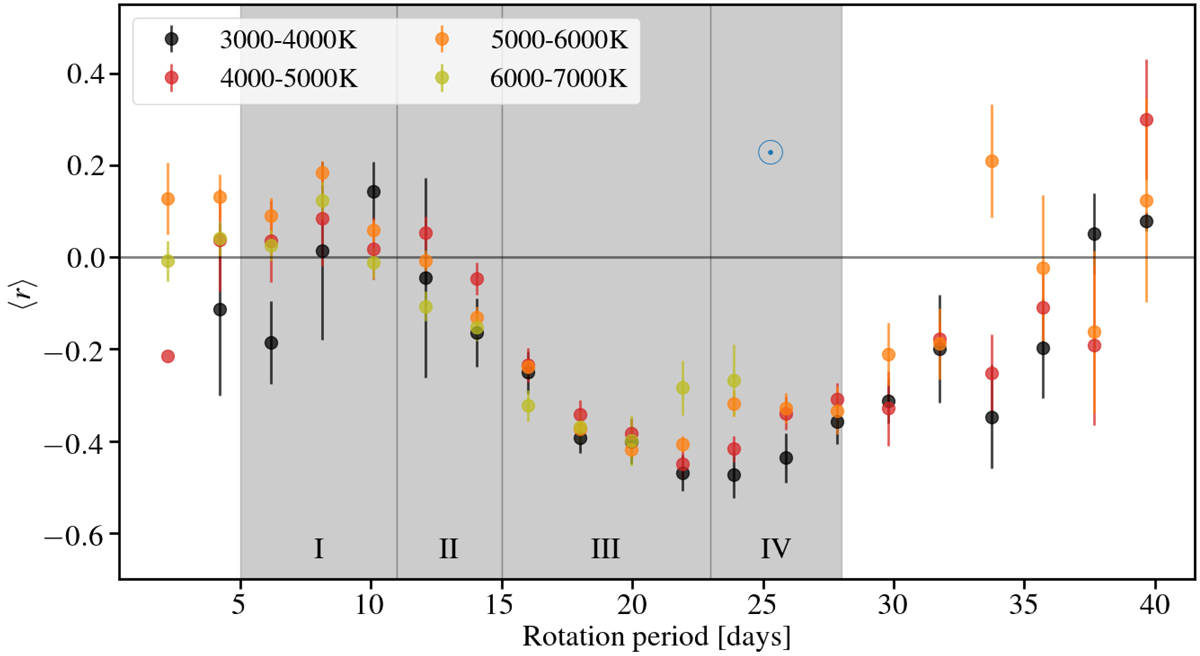
Average correlation coefficient ⟨r⟩ of ΔA(t)/A̅ and ![]() as a function of rotation period. Colors denote subsamples of different temperatures. Period ranges of particular interest are shaded gray and labeled in roman numerals. The number density diminishes to only a few tens of stars at very short and very long rotation periods, particularly for the extremes of the temperature range. The sample does not contain any stars with temperatures above 6000 K with rotation periods longer than 25 days. The correlation of the solar spot rotation rates (blue in Fig. 3) and variability amplitude is indicated by a blue ⊙ at the Carrington rotation period.
as a function of rotation period. Colors denote subsamples of different temperatures. Period ranges of particular interest are shaded gray and labeled in roman numerals. The number density diminishes to only a few tens of stars at very short and very long rotation periods, particularly for the extremes of the temperature range. The sample does not contain any stars with temperatures above 6000 K with rotation periods longer than 25 days. The correlation of the solar spot rotation rates (blue in Fig. 3) and variability amplitude is indicated by a blue ⊙ at the Carrington rotation period.
Current usage metrics show cumulative count of Article Views (full-text article views including HTML views, PDF and ePub downloads, according to the available data) and Abstracts Views on Vision4Press platform.
Data correspond to usage on the plateform after 2015. The current usage metrics is available 48-96 hours after online publication and is updated daily on week days.
Initial download of the metrics may take a while.