Fig. 3.
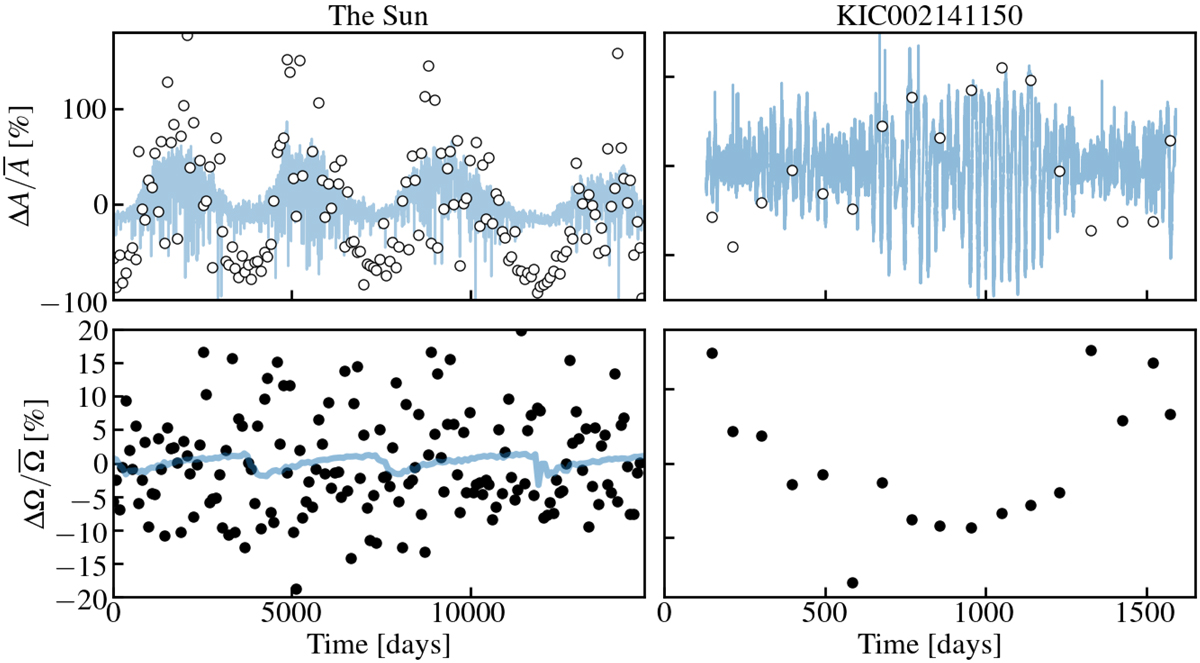
Activity variability amplitude ΔA(t)/A̅ (top panels, open circles) and relative spot rotation rate ![]() (bottom panels, filled circles) for the Sun (left panels) and an example star KIC002141150 (right panels), which has a cycle period of approximately four years. The solar values are based on TSI observations covering approximately 42 years (blue in top left frame). The Kepler data (blue in top right frame) consist of quarterly measurements and so the solar data are likewise separated into 90 day bins (equivalent to Kepler quarters). In the lower left frame the blue curve indicates the solar
(bottom panels, filled circles) for the Sun (left panels) and an example star KIC002141150 (right panels), which has a cycle period of approximately four years. The solar values are based on TSI observations covering approximately 42 years (blue in top left frame). The Kepler data (blue in top right frame) consist of quarterly measurements and so the solar data are likewise separated into 90 day bins (equivalent to Kepler quarters). In the lower left frame the blue curve indicates the solar ![]() computed based on the latitudes of directly observed sunspots.
computed based on the latitudes of directly observed sunspots.
Current usage metrics show cumulative count of Article Views (full-text article views including HTML views, PDF and ePub downloads, according to the available data) and Abstracts Views on Vision4Press platform.
Data correspond to usage on the plateform after 2015. The current usage metrics is available 48-96 hours after online publication and is updated daily on week days.
Initial download of the metrics may take a while.