Fig. 2.
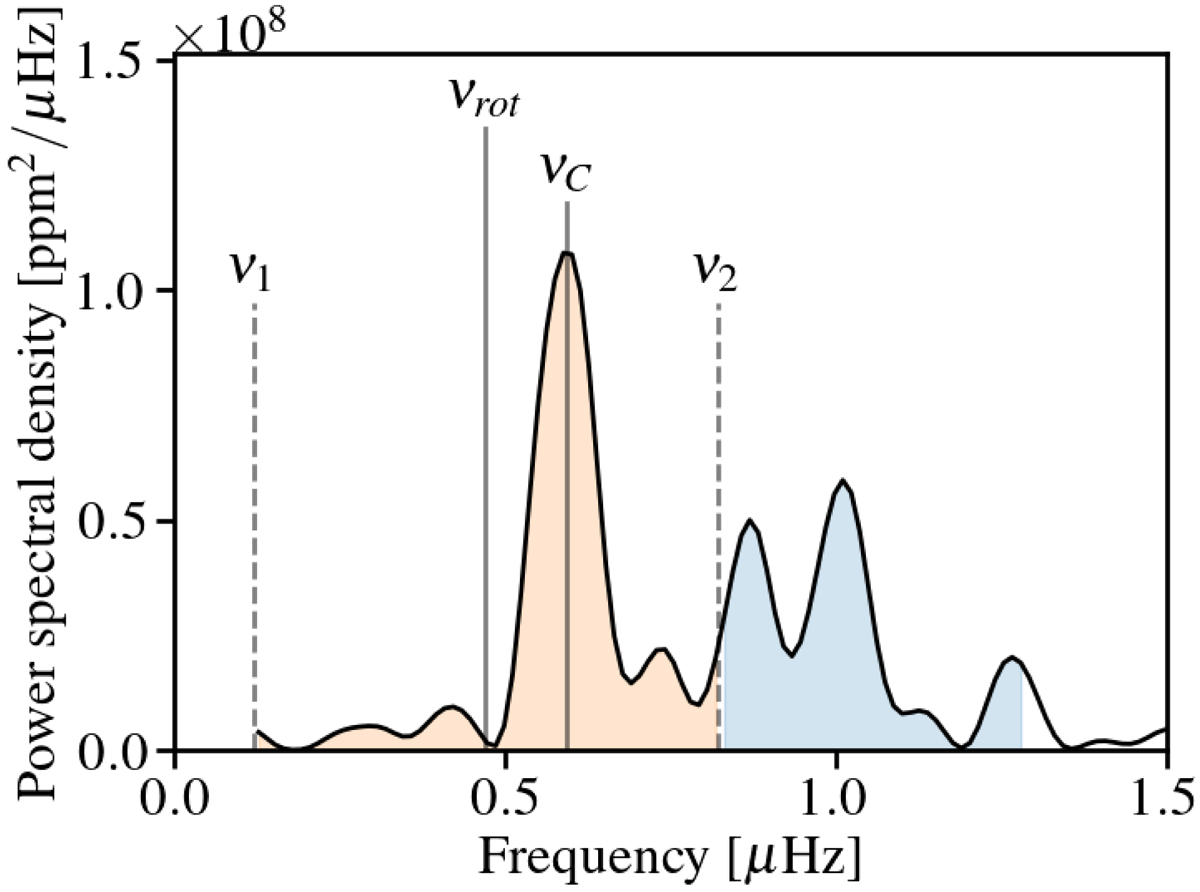
Illustration of the measured variability quantities in an example power spectrum of KIC002141150 during Q14. We use the interval between ν1 and ν2 (orange shaded region) as a representation of the starspot variability. The variance in the light curve caused by active regions is proportional to the integral of the power in this interval. The rotation rate at the spot latitude is measured by the centroid νC. The interval is centered on the average rotation rate νrot of the star, obtained from McQuillan et al. (2014). The blue region shows the first harmonic of the rotation period.
Current usage metrics show cumulative count of Article Views (full-text article views including HTML views, PDF and ePub downloads, according to the available data) and Abstracts Views on Vision4Press platform.
Data correspond to usage on the plateform after 2015. The current usage metrics is available 48-96 hours after online publication and is updated daily on week days.
Initial download of the metrics may take a while.