Fig. 3.
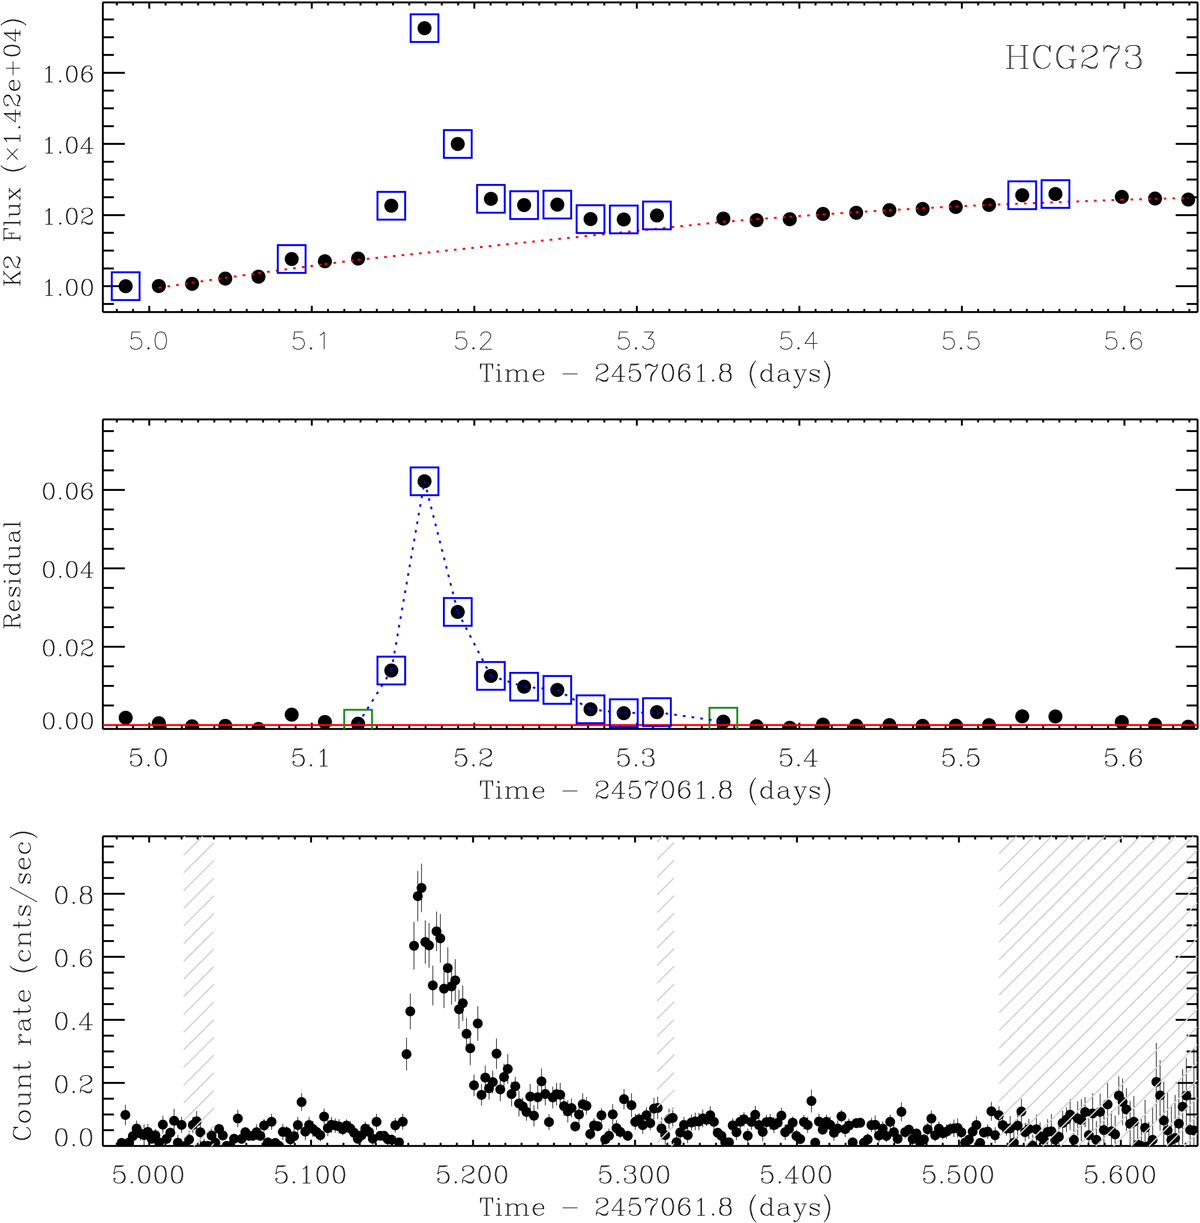
Light curves of HCG 273. Top panel: K2 light curve. The error bars of K2 data points are smaller than the plot symbols. The red dotted line marks the polynomial used to fit the quiescent light curve and is limited to the portion of the K2 light curve for which the fit is performed; the blue squares mark the points corresponding to the flare. Central panel: residuals of the K2 light curve from the best-fit polynomial function limited in the portion of the light curve where the fit is performed (limited by the vertical dotted lines). The green squares mark the K2 points just before and after the flare. Bottom panel: combined background-subtracted MOS+PN X-ray light curve. Shaded regions are “bad time intervals” in at least one EPIC detector.
Current usage metrics show cumulative count of Article Views (full-text article views including HTML views, PDF and ePub downloads, according to the available data) and Abstracts Views on Vision4Press platform.
Data correspond to usage on the plateform after 2015. The current usage metrics is available 48-96 hours after online publication and is updated daily on week days.
Initial download of the metrics may take a while.