Fig. 19.
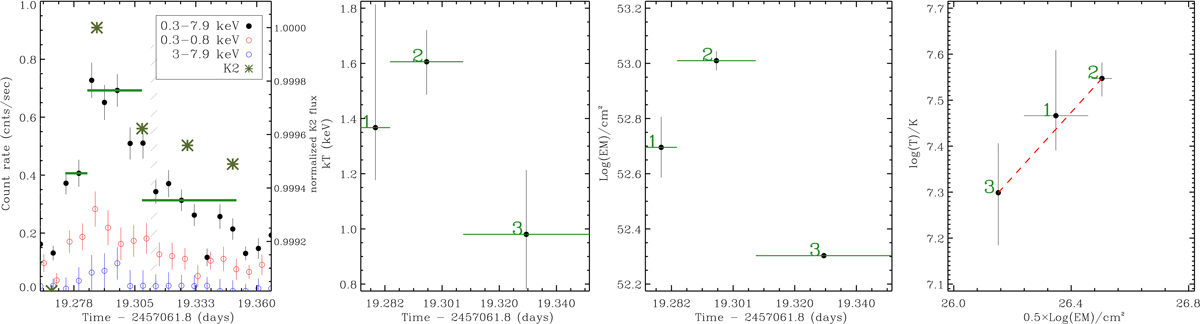
Evolution of the flare observed in HII 405. Left panel: merged MOS+PN light curve in broad, soft, and hard energy bands (dots) superimposed on the K2 light curve (green asterisks). The horizontal green lines mark the defined blocks and the vertical dashed areas correspond to the bad time intervals (Sect. 3.2). Central panels: time evolution of plasma temperature and emission measure, right panel: evolution of the flare in the log(T) vs. 0.5 × log(EM) plane. The red dashed line marks the slope of the cooling phase.
Current usage metrics show cumulative count of Article Views (full-text article views including HTML views, PDF and ePub downloads, according to the available data) and Abstracts Views on Vision4Press platform.
Data correspond to usage on the plateform after 2015. The current usage metrics is available 48-96 hours after online publication and is updated daily on week days.
Initial download of the metrics may take a while.