Fig. 18.
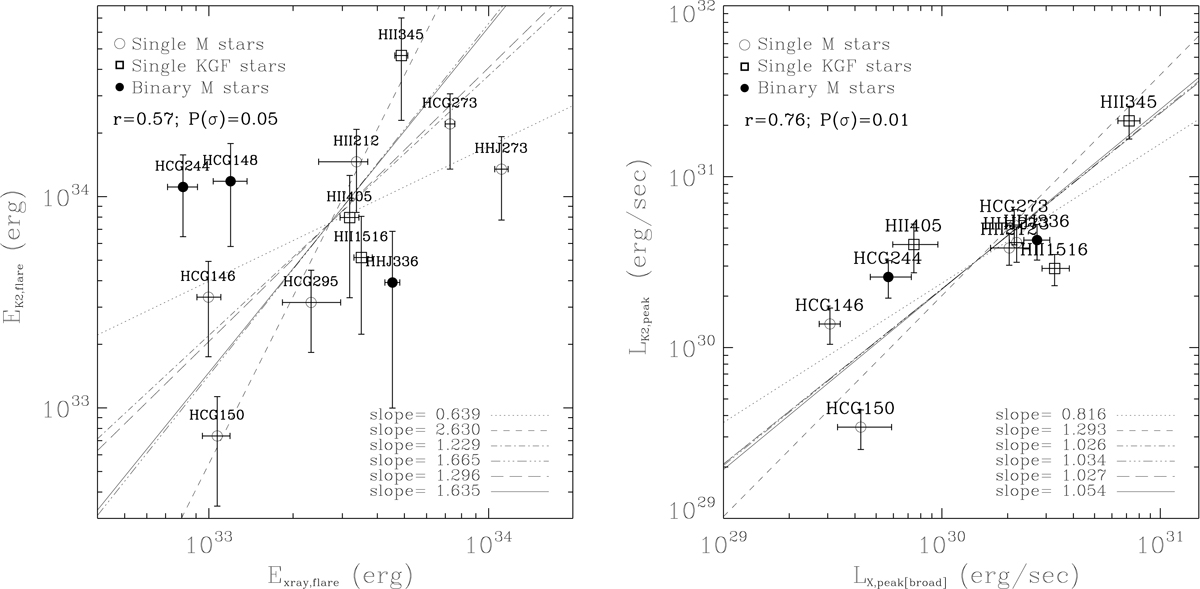
Comparison between the total emitted energy (left panel) and the peak luminosity (right panel) in optical and X-ray light. The name of each star is also indicated. The lines mark six linear fits between the log values performed with the IDL routine SIXLIN. The resulting slopes are also indicated. We also show the Spearman’s rank correlation coefficient and the significance of its deviation from zero. These flares typically released more energy and had a larger peak luminosity in the optical than in X-rays.
Current usage metrics show cumulative count of Article Views (full-text article views including HTML views, PDF and ePub downloads, according to the available data) and Abstracts Views on Vision4Press platform.
Data correspond to usage on the plateform after 2015. The current usage metrics is available 48-96 hours after online publication and is updated daily on week days.
Initial download of the metrics may take a while.