Fig. 16.
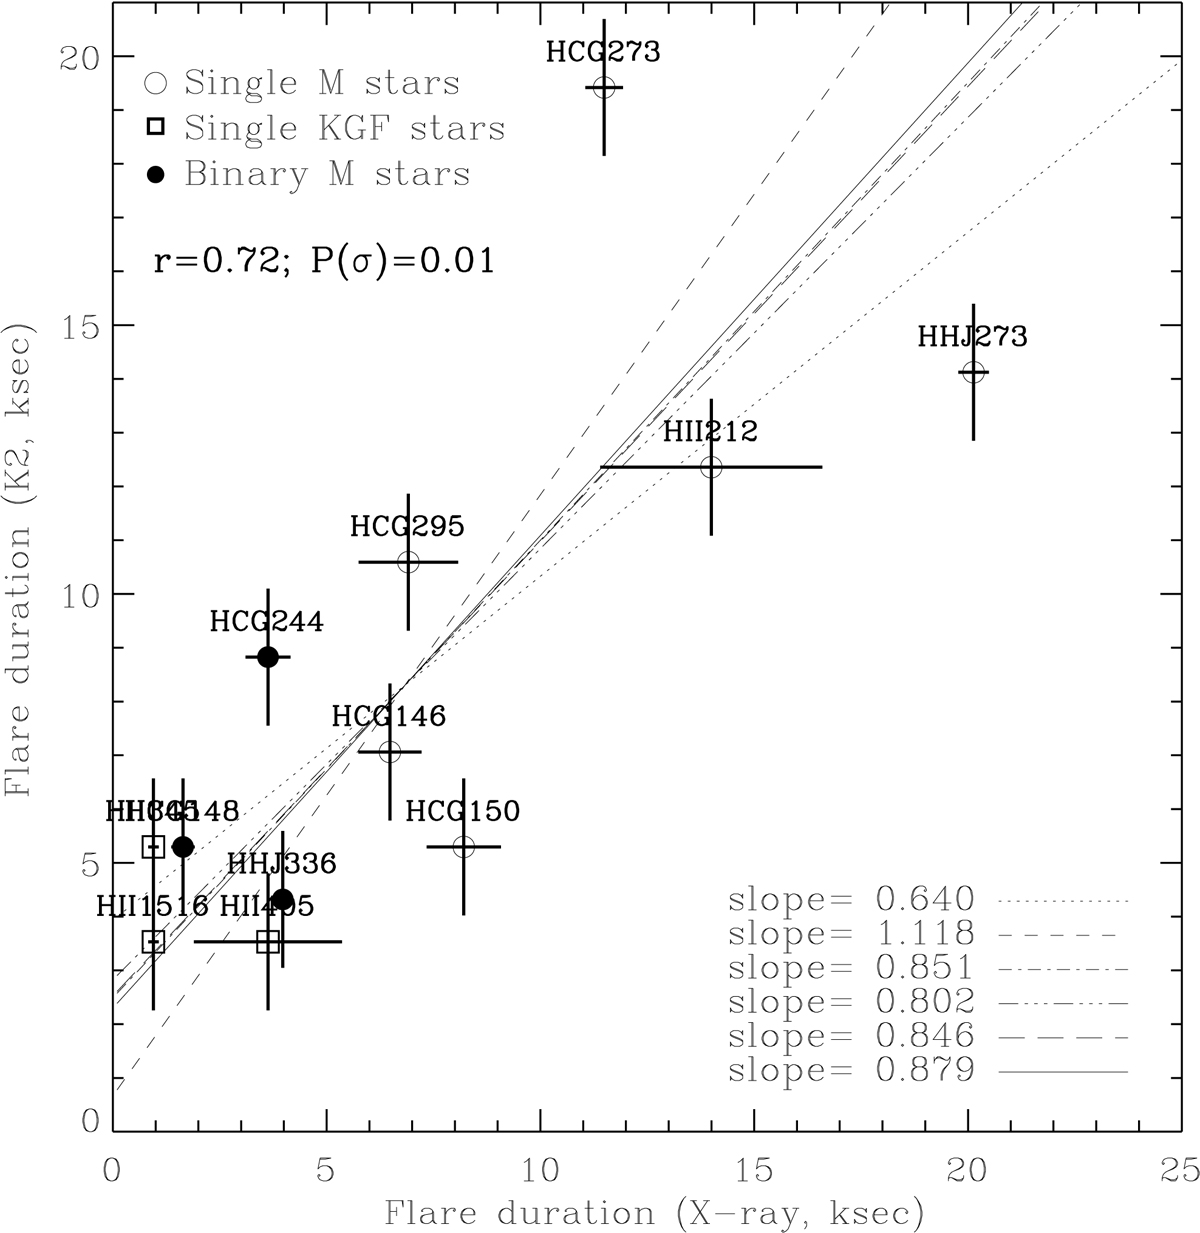
Flare duration in optical vs. X-ray light. For each data point, we show the name of the star. The lines mark six linear fits performed with the IDL routine SIXLIN. The resulting slopes are indicated in the bottom-right corner (from top to bottom, the fitting methods are: Ordinary Least Squares Y vs. X, Ordinary Least Squares X vs. Y, Ordinary Least Squares Bisector, Orthogonal Reduced Major Axis, Reduced Major-Axis, Mean ordinary Least Squares). In the left corner we show the results from a Spearman correlation. We observe significant correlation between the flare duration in the two bands, and can see that the flares occurring in the KGF stars were shorter than those in M stars.
Current usage metrics show cumulative count of Article Views (full-text article views including HTML views, PDF and ePub downloads, according to the available data) and Abstracts Views on Vision4Press platform.
Data correspond to usage on the plateform after 2015. The current usage metrics is available 48-96 hours after online publication and is updated daily on week days.
Initial download of the metrics may take a while.