Fig. 7
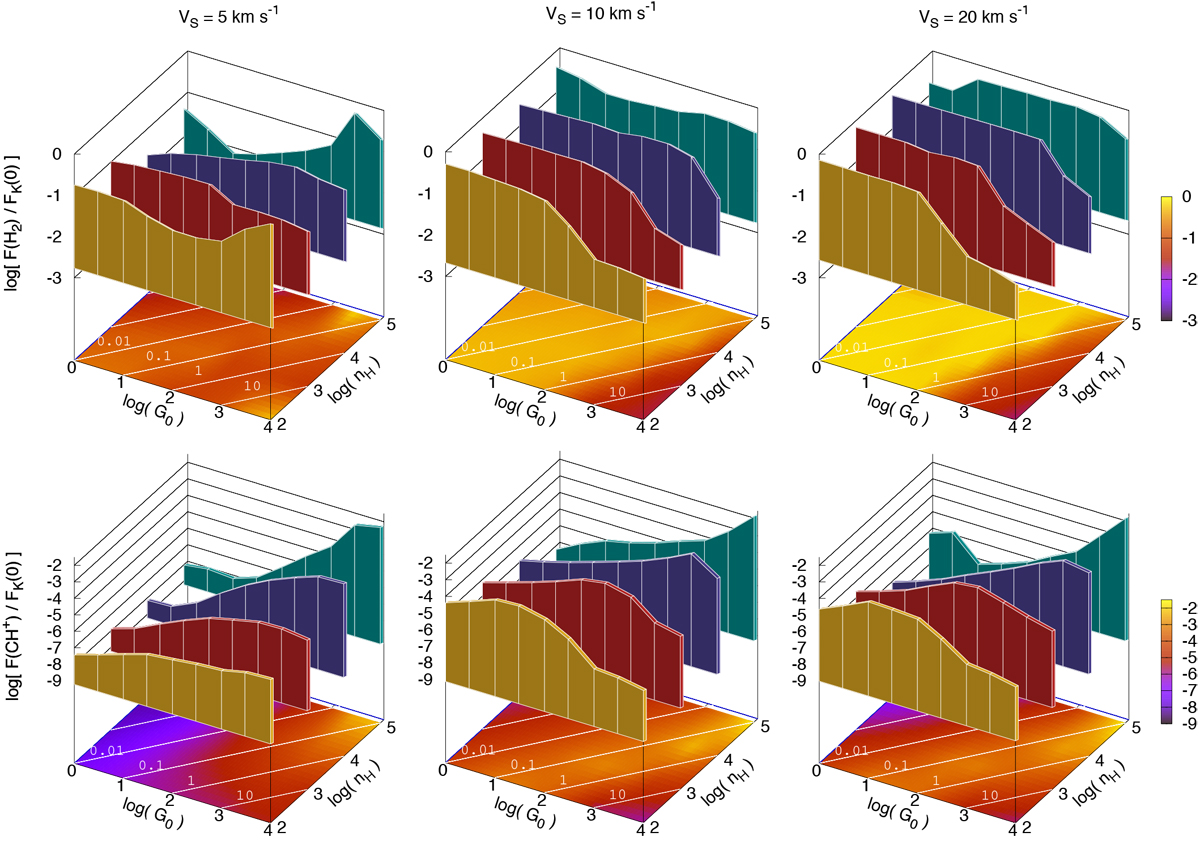
Total fluxes of H2 rovibrational lines (top panels) and CH+ rotational lines (bottompanels, summed up to the J = 10 → 9 transition)emerging from shocks propagating at 5 (left panels), 10 (middle panels), and 20 (right panels) km s−1 in different environments, for a buffer visual extinction ![]() . The non-varying parameters are set to their standard values (see Table 1). All fluxes are normalized to the input kinetic energy flux of the shock
. The non-varying parameters are set to their standard values (see Table 1). All fluxes are normalized to the input kinetic energy flux of the shock
![]() . The results are displayed simultaneously as colour maps and fence plots at fixed densities of
102 (yellow),
103 (red),
104 (blue), and 105 (green) cm−3. White lines on the colour maps indicate contours of constant G0∕nH
ratio.
. The results are displayed simultaneously as colour maps and fence plots at fixed densities of
102 (yellow),
103 (red),
104 (blue), and 105 (green) cm−3. White lines on the colour maps indicate contours of constant G0∕nH
ratio.
Current usage metrics show cumulative count of Article Views (full-text article views including HTML views, PDF and ePub downloads, according to the available data) and Abstracts Views on Vision4Press platform.
Data correspond to usage on the plateform after 2015. The current usage metrics is available 48-96 hours after online publication and is updated daily on week days.
Initial download of the metrics may take a while.