Fig. C.1
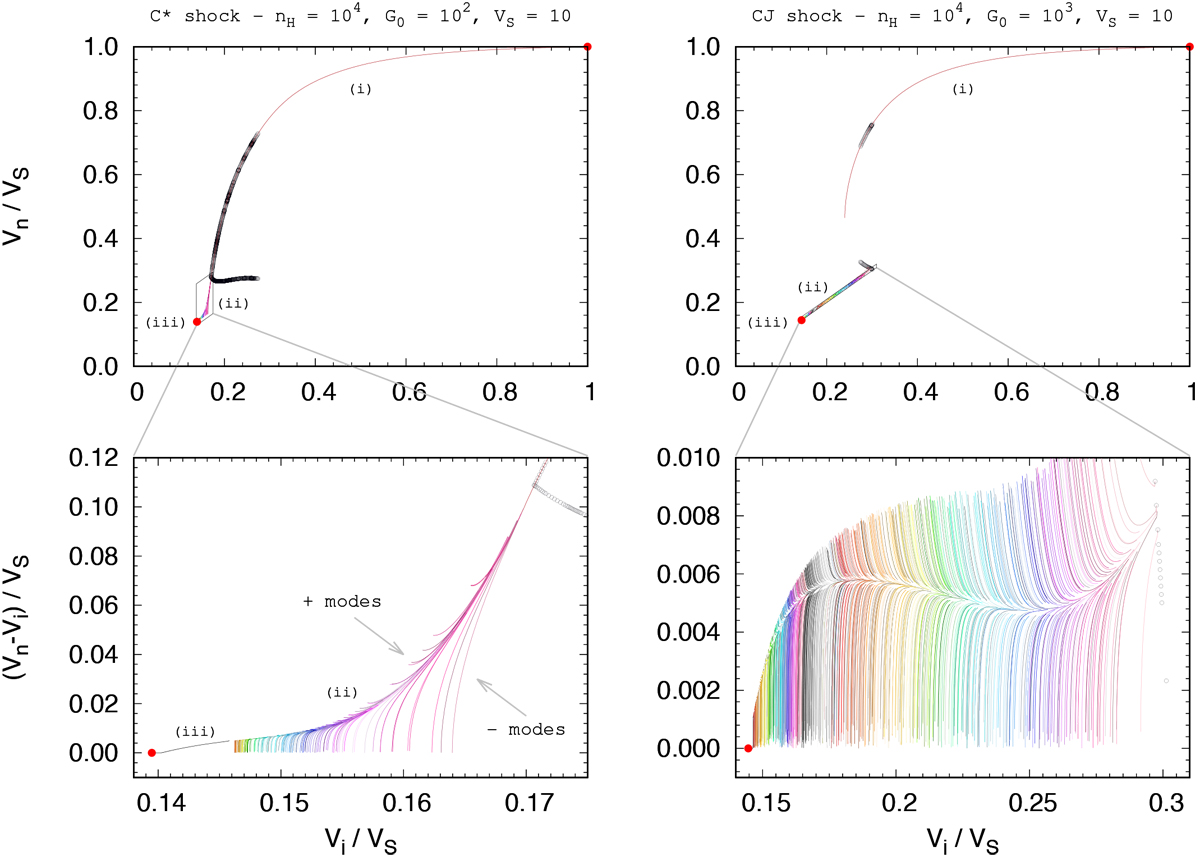
Phase diagrams of stationary shocks propagating at a speed of 10 km s−1 in a pre-shock medium with a density of 104 cm−3, located at 0.6 mpc of the ionization front illuminated by an isotropic radiation field of G0 = 102 (left panels) and 103 (right panels). All other parameters are set to their standard values (see Table 1). The coloured curves correspond to the potential trajectories computed by the algorithm described in Appendix C. The true stationary solution connects the upstream and downstream trajectories (i) and (iii). This solution is bounded in the subsonic excursion (labelled ii) by the + and − modes (see main text). Top panels: neutral and ion velocities relative to the velocity of the shock. Bottom panels: zooms of the top panels rotated to highlight the ion-neutral velocity drift. Initial and final kinematic states and potential jump conditions are indicated with red points and black circles, respectively.
Current usage metrics show cumulative count of Article Views (full-text article views including HTML views, PDF and ePub downloads, according to the available data) and Abstracts Views on Vision4Press platform.
Data correspond to usage on the plateform after 2015. The current usage metrics is available 48-96 hours after online publication and is updated daily on week days.
Initial download of the metrics may take a while.