Fig. 10.
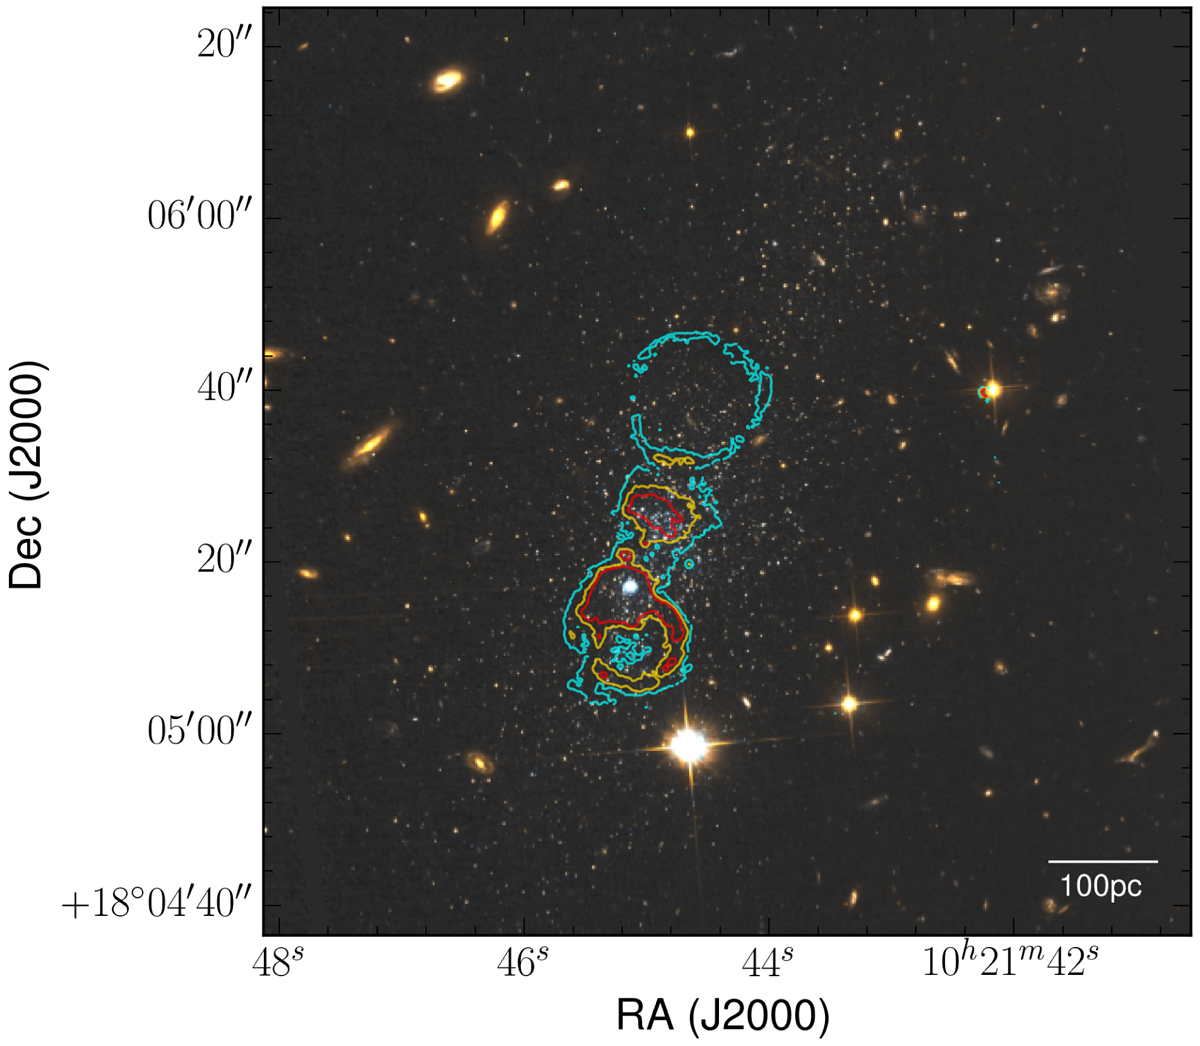
Hα emission in Leo P overlaid on the combined F475W + F814W HST image (cyan, yellow and red contours are Hα-emission levels of 5, 10, and 15 × 10−20 erg s−1 cm−2, respectively). The known H II region is the compact blue source in the main southern feature. The MUSE data have also revealed a region of Hα emission just to the north, and two large extended shells to the south and (far) north (see also Fig. 11).
Current usage metrics show cumulative count of Article Views (full-text article views including HTML views, PDF and ePub downloads, according to the available data) and Abstracts Views on Vision4Press platform.
Data correspond to usage on the plateform after 2015. The current usage metrics is available 48-96 hours after online publication and is updated daily on week days.
Initial download of the metrics may take a while.