Fig. 5.
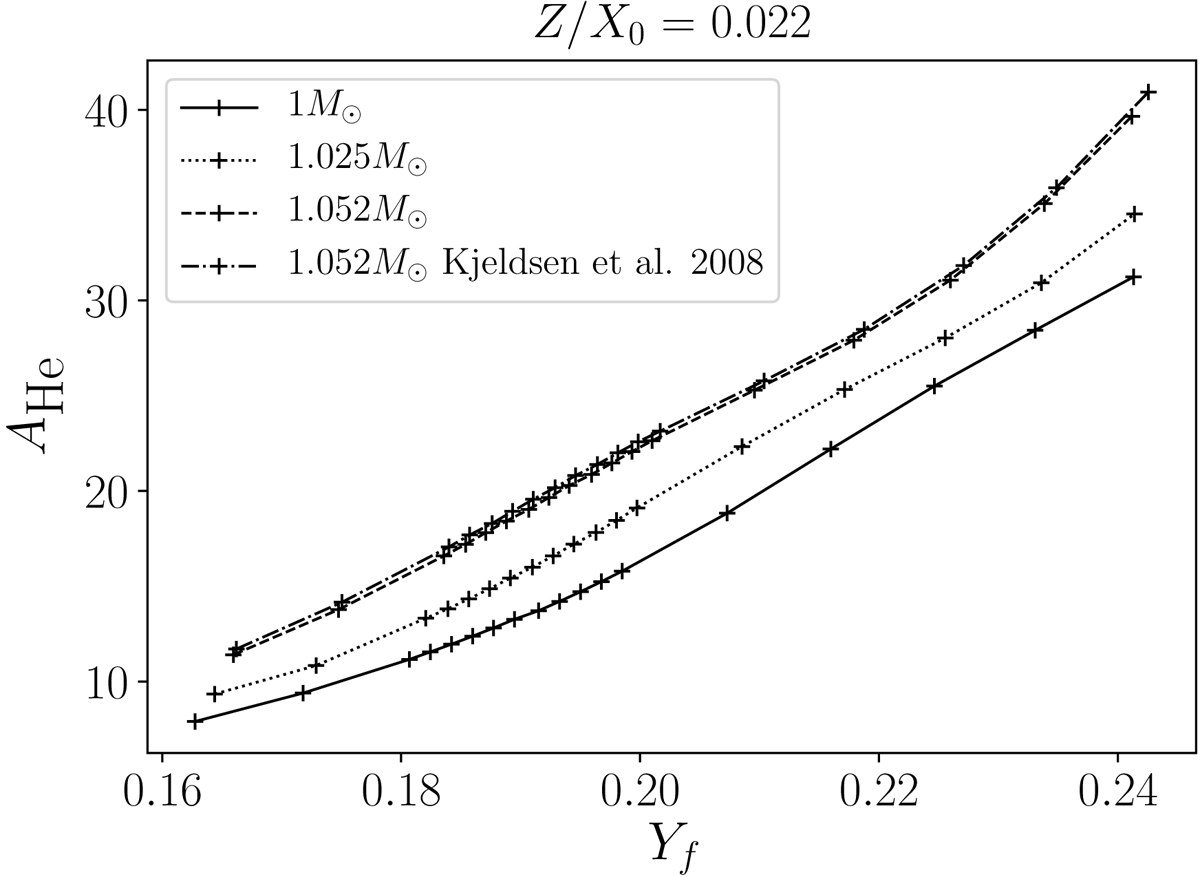
Evolution of the helium glitch amplitude AHe with the surface helium abundance Yf. Each track corresponds to a given mass, written in the legend. The dot-dashed line represents the amplitude for a 1.052 M⊙ model of which the frequencies have been corrected for surface effects as in Kjeldsen et al. (2008). Every model has an initial heavy elements abundance of (Z/X)0 = 0.022. Each point has been computed with the same large separation to remain at the same evolutionary stage.
Current usage metrics show cumulative count of Article Views (full-text article views including HTML views, PDF and ePub downloads, according to the available data) and Abstracts Views on Vision4Press platform.
Data correspond to usage on the plateform after 2015. The current usage metrics is available 48-96 hours after online publication and is updated daily on week days.
Initial download of the metrics may take a while.