Fig. 4.
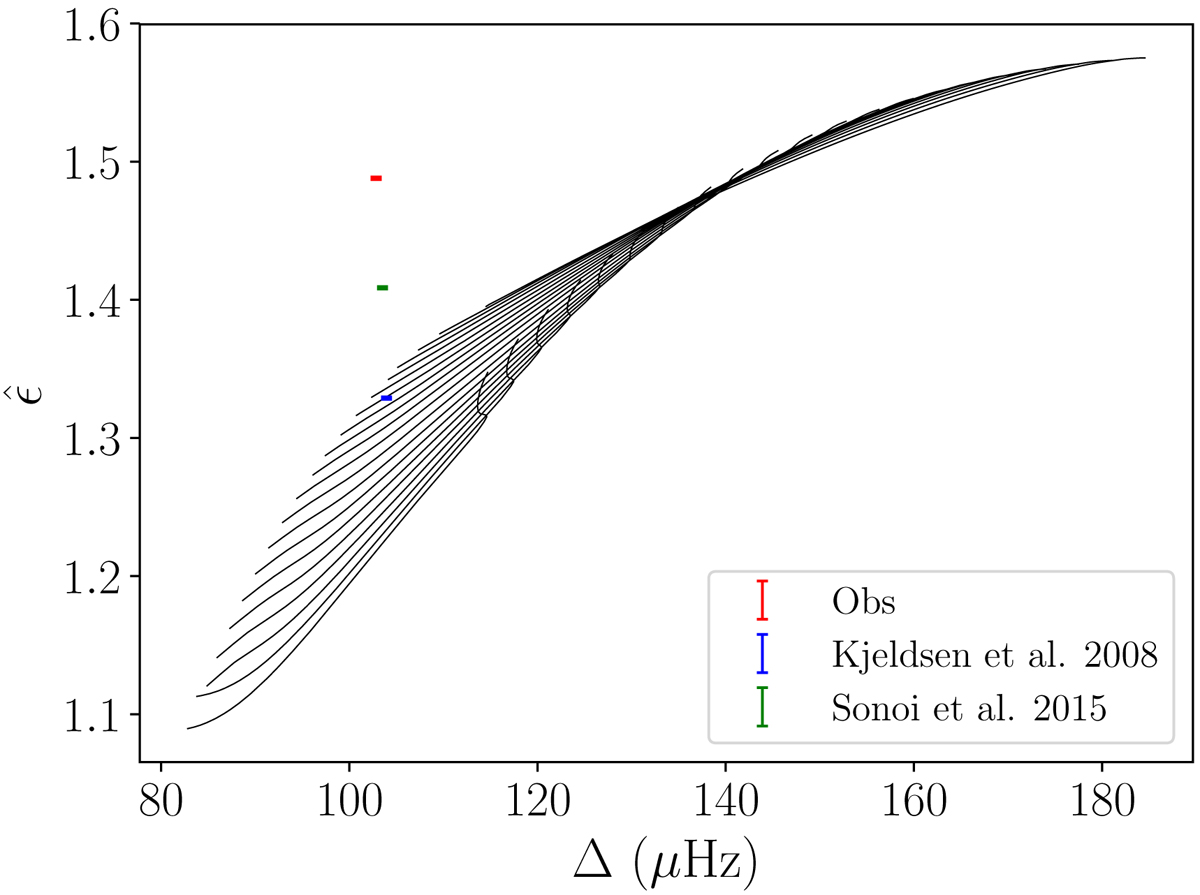
Evolution of ![]() along the grid presented in Sect. 3.1. The masses increase from top to bottom. The step is here of 0.02 M⊙. The red, green, and blue markers respectively represent the observation for 16 Cygni A, the observation for 16 Cygni A corrected for the surface effects using Kjeldsen et al. (2008)’s prescription and the one corrected using Sonoi et al. (2015)’s prescription.
along the grid presented in Sect. 3.1. The masses increase from top to bottom. The step is here of 0.02 M⊙. The red, green, and blue markers respectively represent the observation for 16 Cygni A, the observation for 16 Cygni A corrected for the surface effects using Kjeldsen et al. (2008)’s prescription and the one corrected using Sonoi et al. (2015)’s prescription.
Current usage metrics show cumulative count of Article Views (full-text article views including HTML views, PDF and ePub downloads, according to the available data) and Abstracts Views on Vision4Press platform.
Data correspond to usage on the plateform after 2015. The current usage metrics is available 48-96 hours after online publication and is updated daily on week days.
Initial download of the metrics may take a while.