Fig. 2.
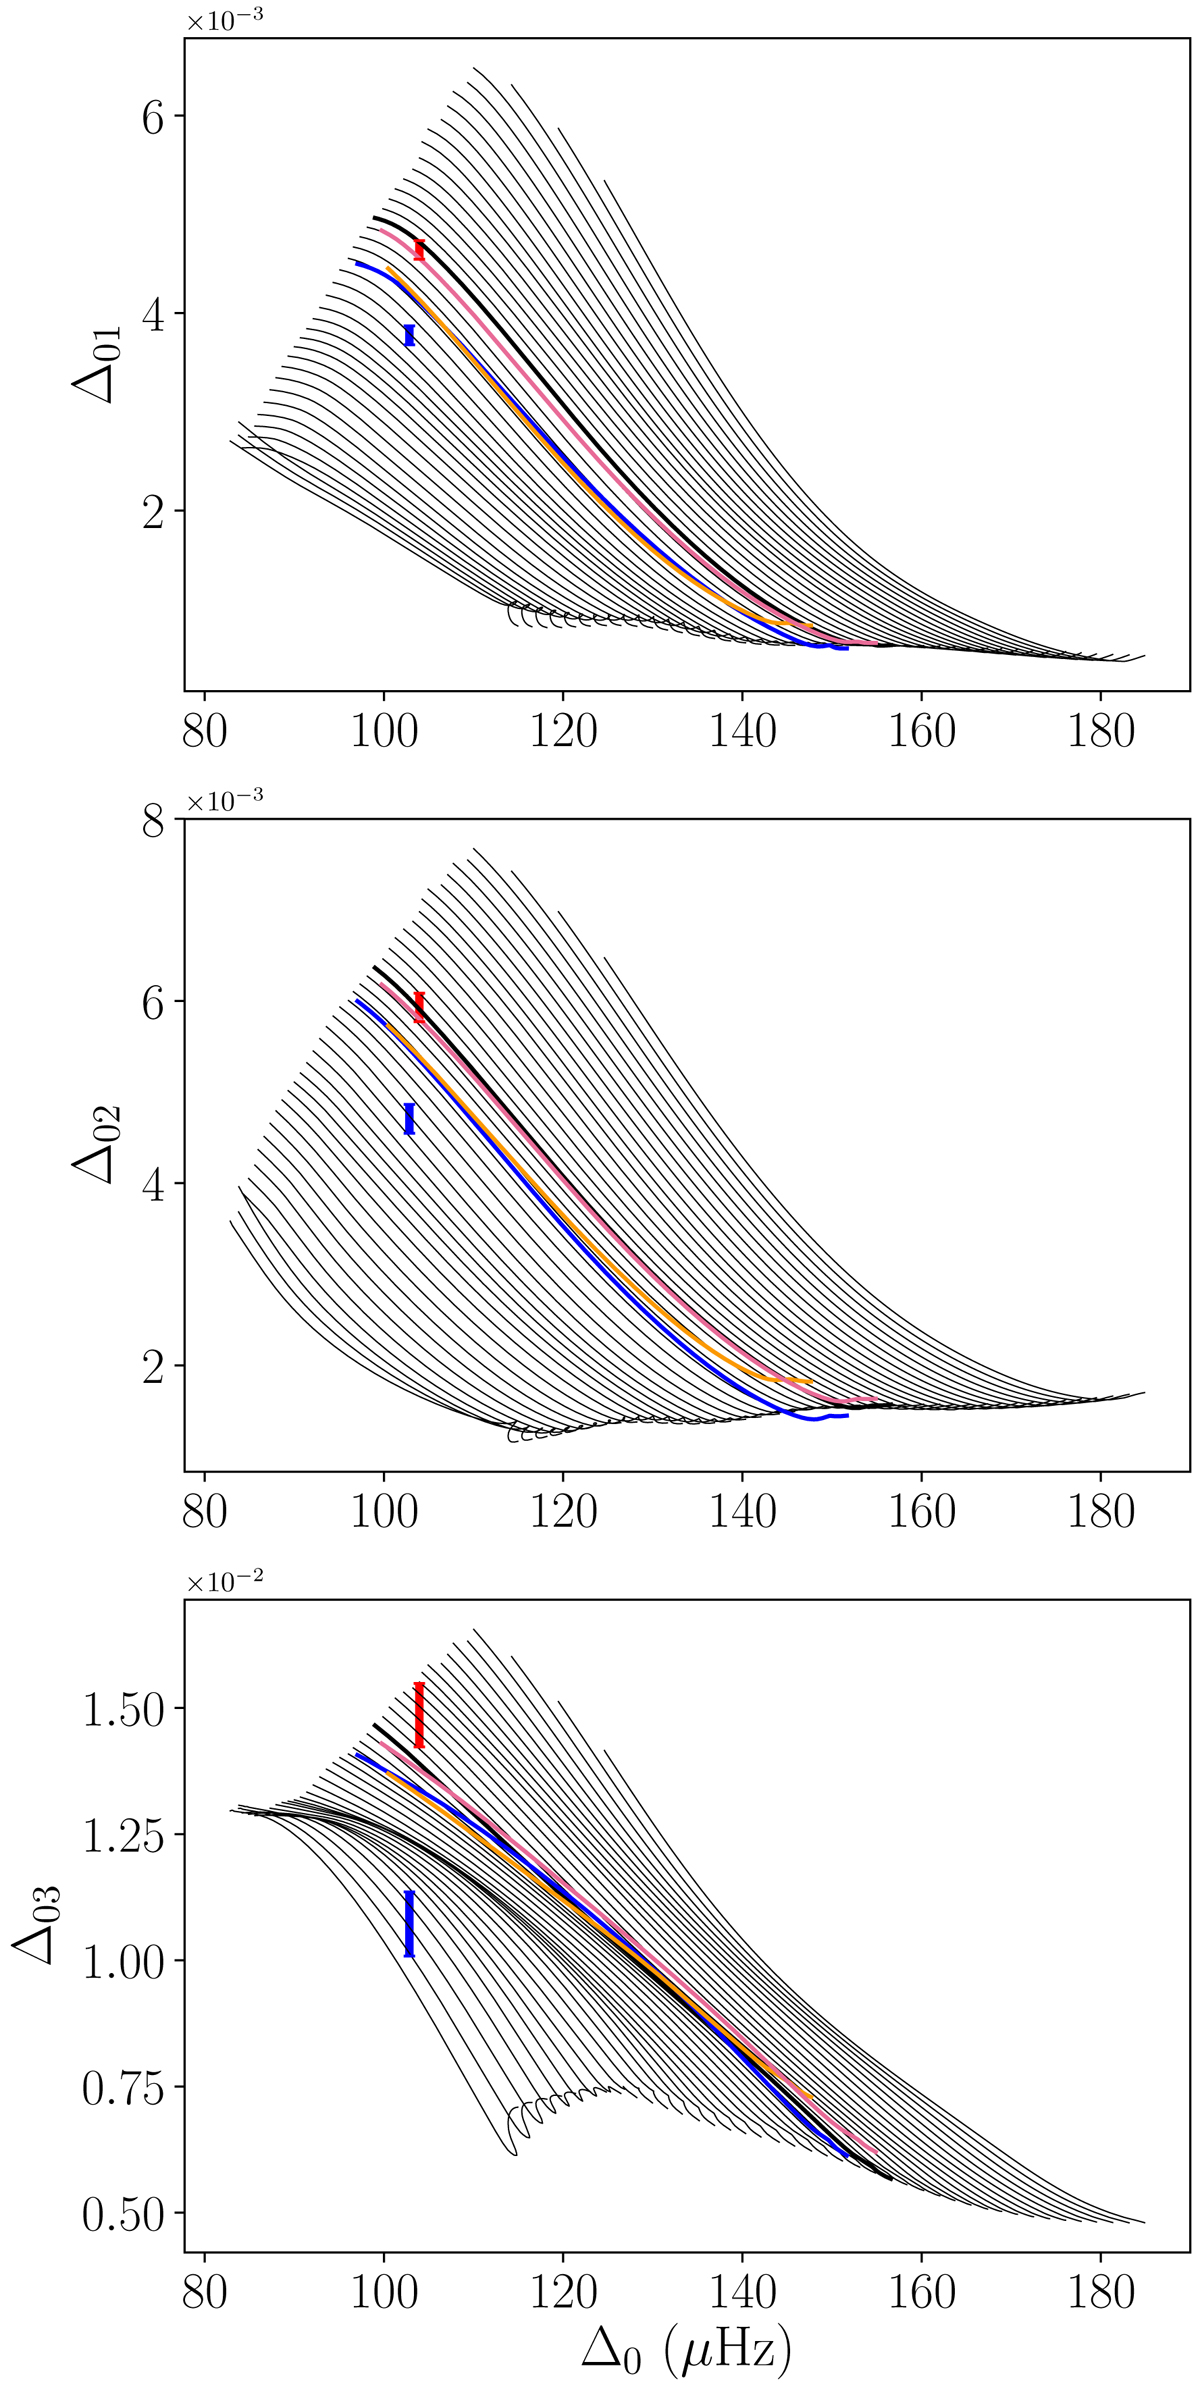
Seismic HR diagram defined with the new indicators Δ0l and computed along the grid presented in Sect. 3.1. The masses increase from right to left. The red marker shows the observed value corrected for the surface effects following Kjeldsen et al. (2008)’s prescription. The thick line represents the track for 1.06 M⊙. The blue line has been computed for Y0 = 0.27, the orange one for αMLT = 1.5, and the pink one for (Z/X)0 = 0.018. All the coloured lines have been computed for 1.06 M⊙.
Current usage metrics show cumulative count of Article Views (full-text article views including HTML views, PDF and ePub downloads, according to the available data) and Abstracts Views on Vision4Press platform.
Data correspond to usage on the plateform after 2015. The current usage metrics is available 48-96 hours after online publication and is updated daily on week days.
Initial download of the metrics may take a while.