Fig. F.1.
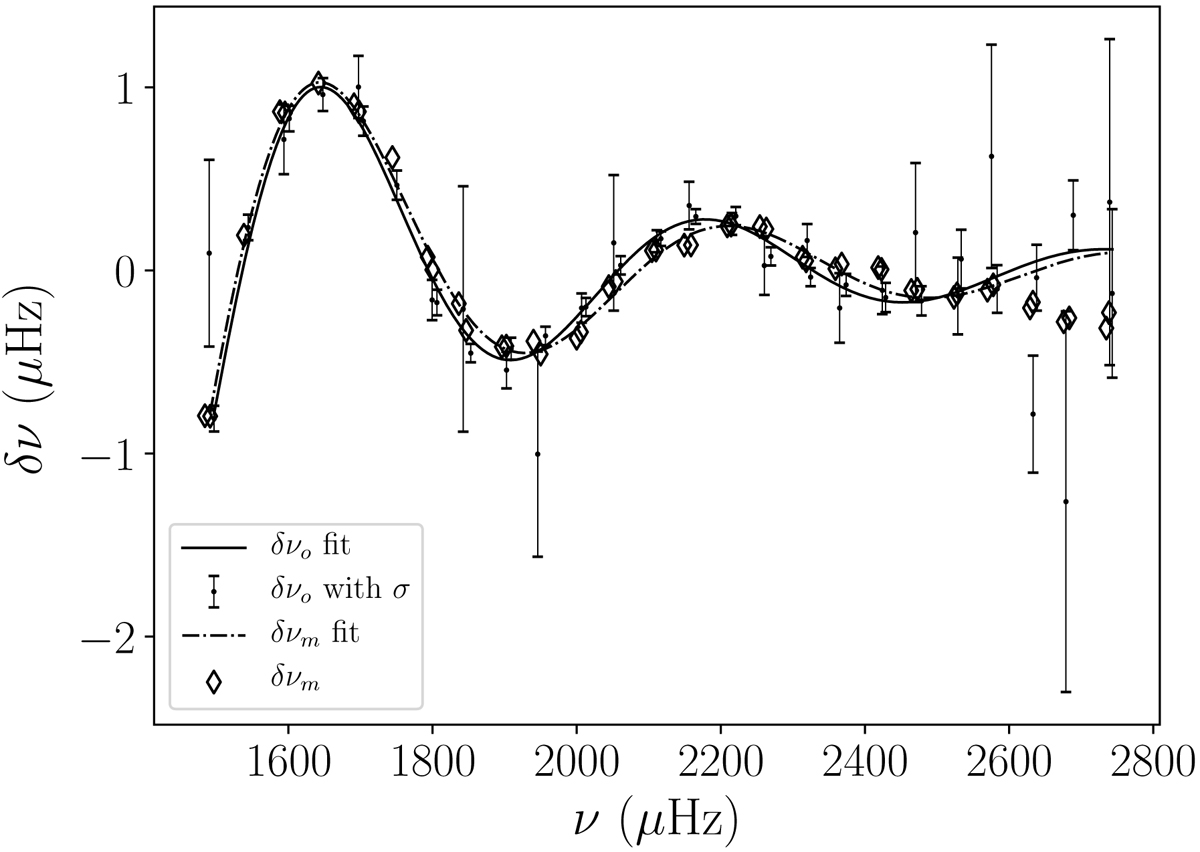
Comparison between the observed helium glitch δνo (solid line) and the one resulting from the best fit model δνm (dot-dashed line) for l = 0. We also display the observed glitch as a function of the frequencies (errorbars) as well as the best model glitch associated with the theoretical frequencies (diamond). The observed frequencies have been corrected for surface effects using Sonoi et al. (2015)’s prescription.
Current usage metrics show cumulative count of Article Views (full-text article views including HTML views, PDF and ePub downloads, according to the available data) and Abstracts Views on Vision4Press platform.
Data correspond to usage on the plateform after 2015. The current usage metrics is available 48-96 hours after online publication and is updated daily on week days.
Initial download of the metrics may take a while.