Free Access
Fig. E.1.
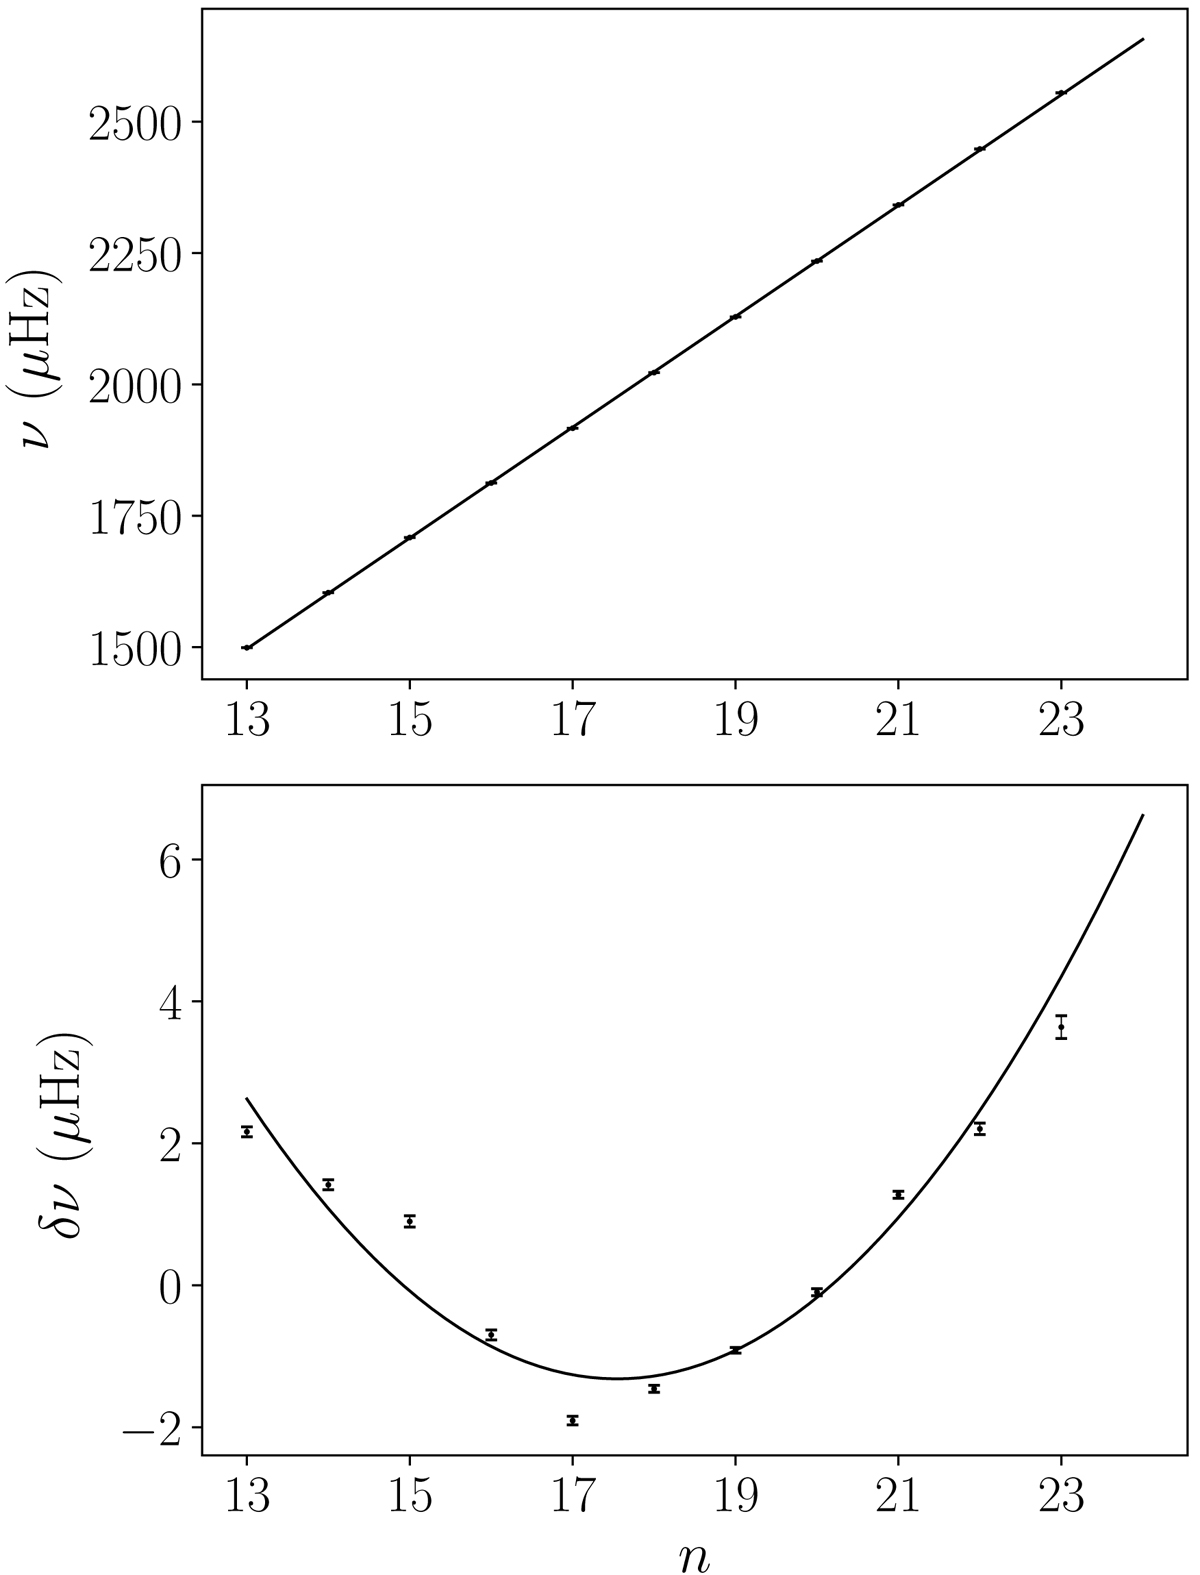
Comparison between the successive adjustments and the observed radial modes frequencies listed in Table E.1. Upper panel: observed frequencies compared to the first order adjustment; lower panel: residual of the first order adjustment compared to the second order fit to those residuals.
Current usage metrics show cumulative count of Article Views (full-text article views including HTML views, PDF and ePub downloads, according to the available data) and Abstracts Views on Vision4Press platform.
Data correspond to usage on the plateform after 2015. The current usage metrics is available 48-96 hours after online publication and is updated daily on week days.
Initial download of the metrics may take a while.