Free Access
Fig. A.1.
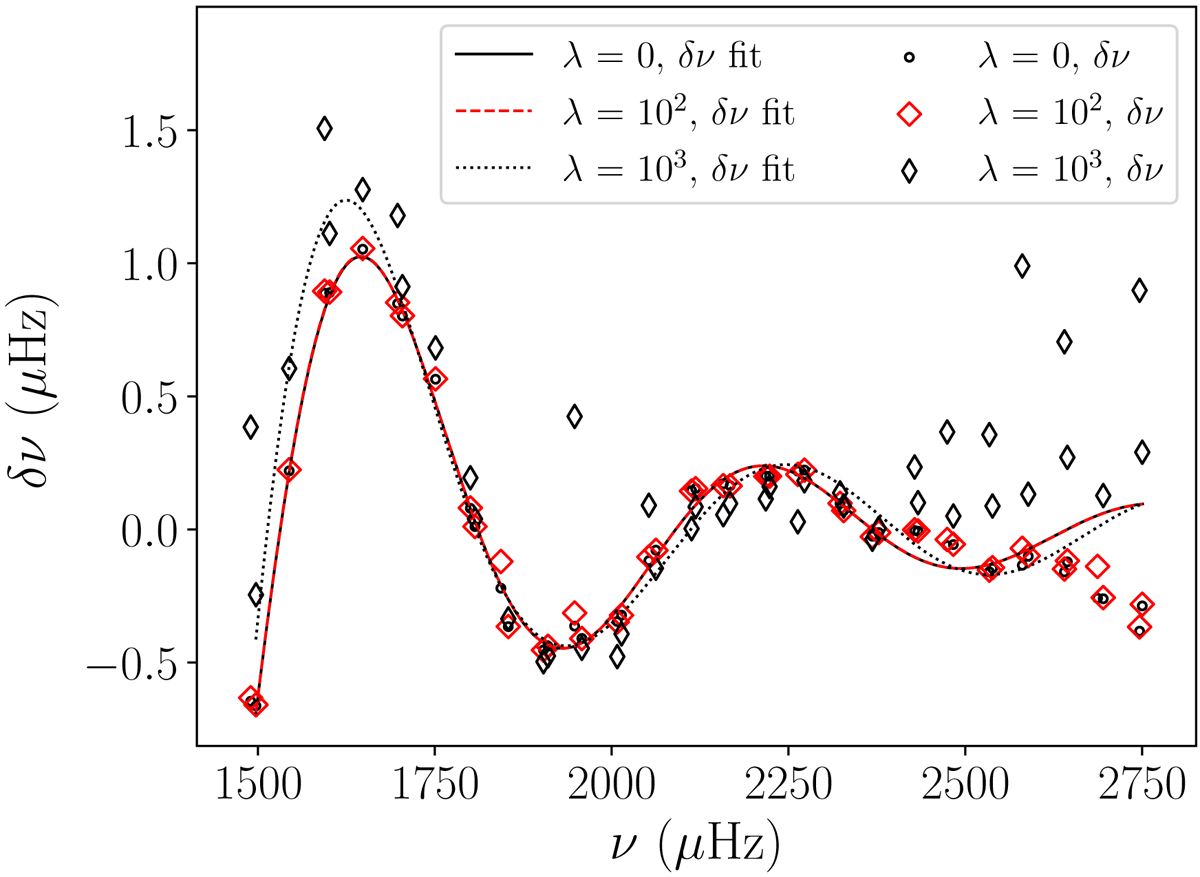
Comparison between the glitch adjustment for several values of the regularisation constant λ for 16 Cyg A best model determined in Sect. 5.2. The values are given in the legend. The lines correspond to the fitted glitch and the markers to the observed glitch. Only the fitted curves for l = 0 are displayed.
Current usage metrics show cumulative count of Article Views (full-text article views including HTML views, PDF and ePub downloads, according to the available data) and Abstracts Views on Vision4Press platform.
Data correspond to usage on the plateform after 2015. The current usage metrics is available 48-96 hours after online publication and is updated daily on week days.
Initial download of the metrics may take a while.