Fig. 11.
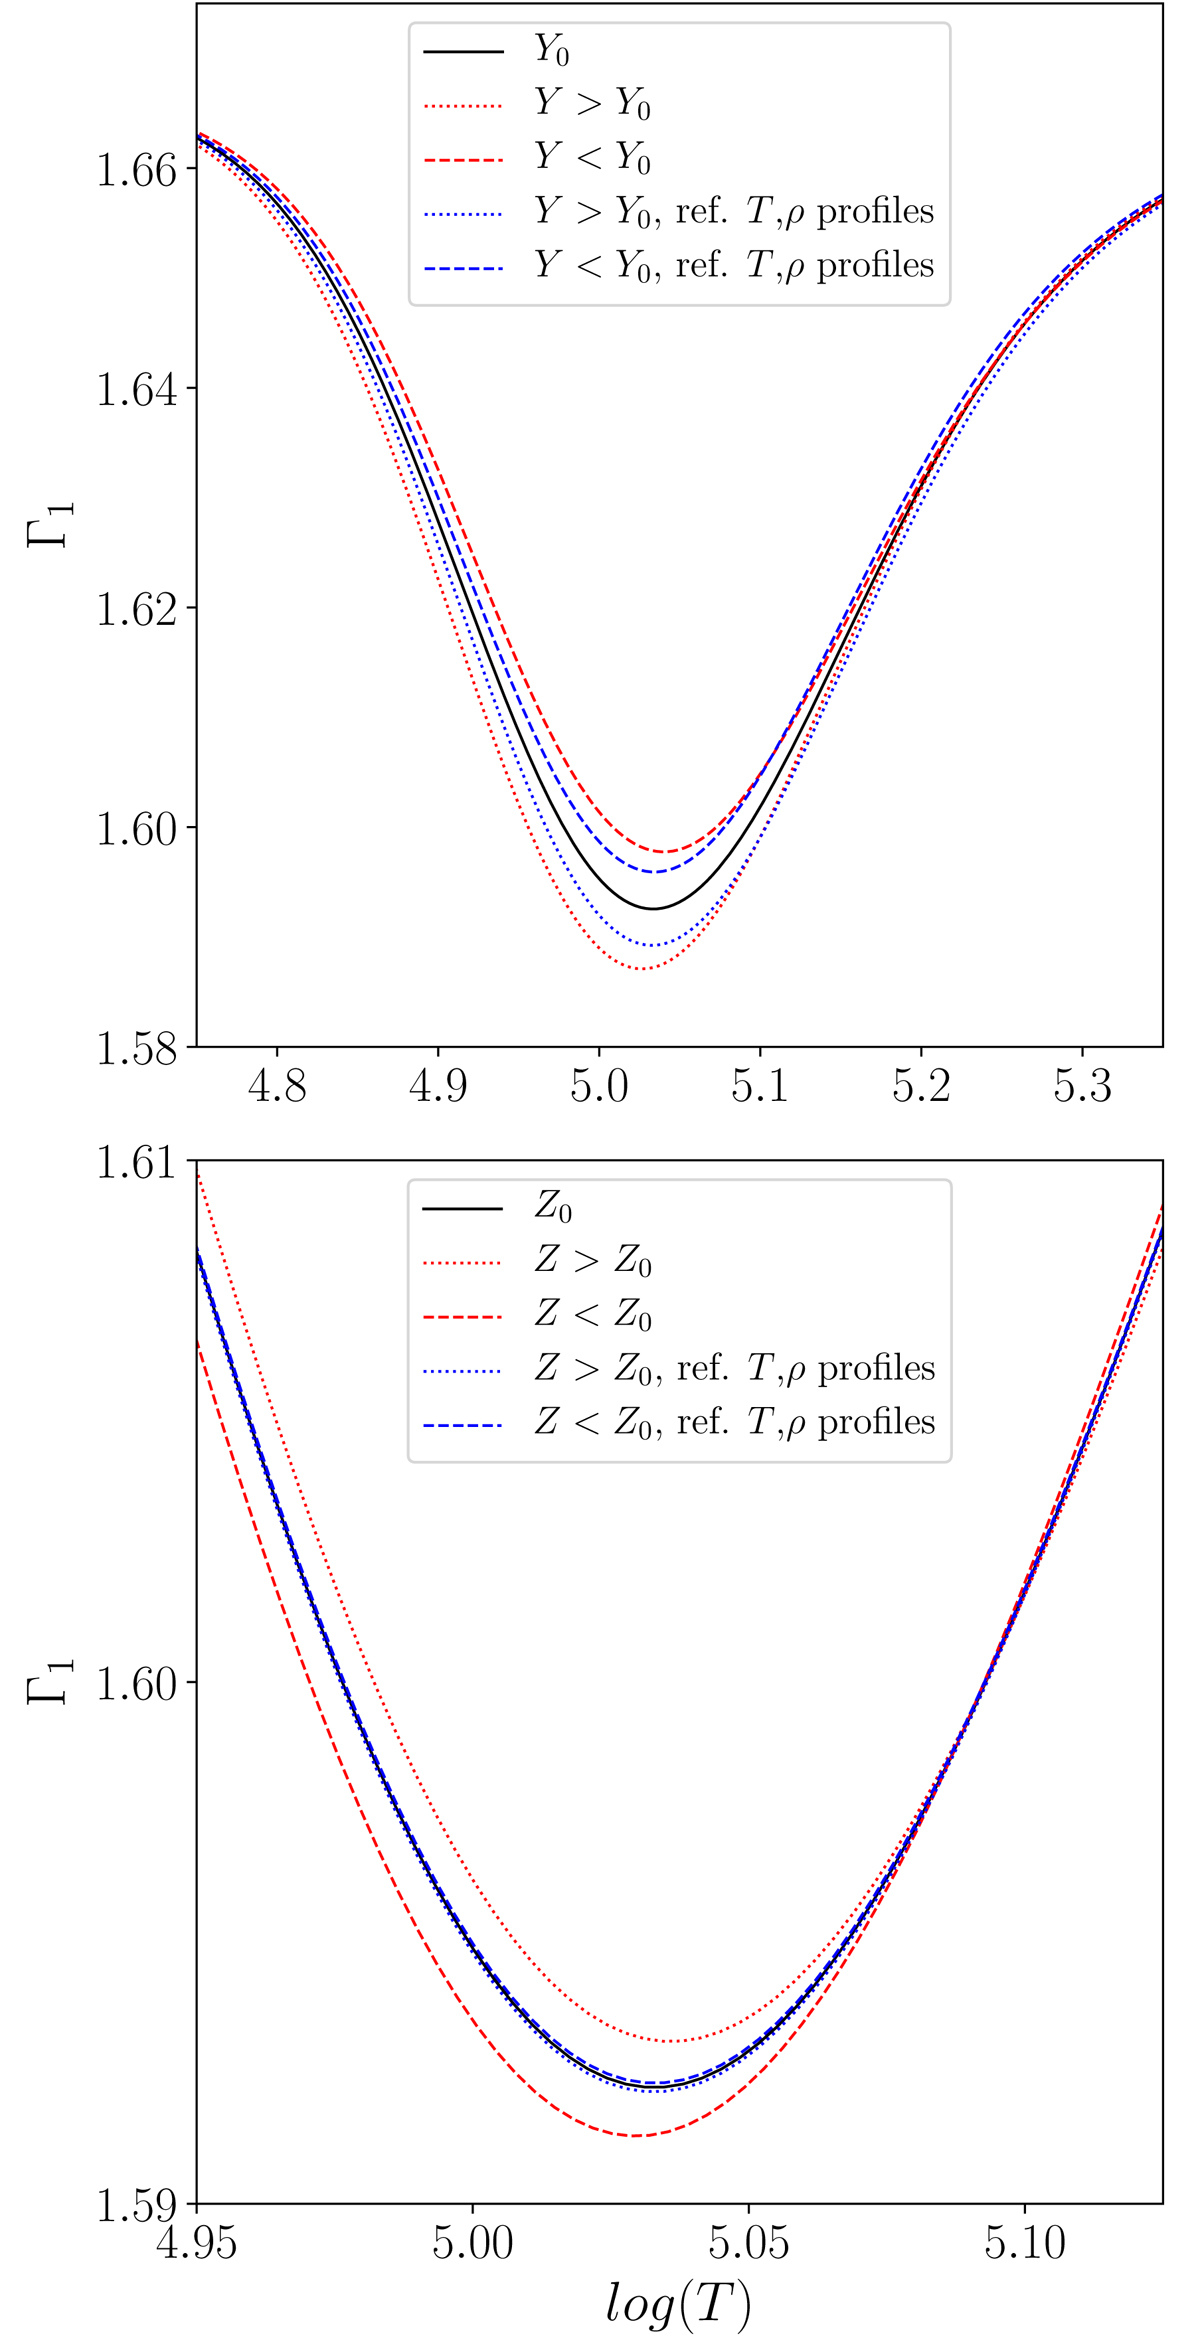
Comparison with a reference model (black curve) of the toy model Γ1 profiles in cases for which the temperature and density profiles have been decoupled from the composition profiles (blue curves) and coupled cases (red curves). The dashed lines have a common decreased abundance of the considered element and the dotted lines have an increased abundance. Top panel: effect of the helium abundance; bottom panel: effect of the metals abundance.
Current usage metrics show cumulative count of Article Views (full-text article views including HTML views, PDF and ePub downloads, according to the available data) and Abstracts Views on Vision4Press platform.
Data correspond to usage on the plateform after 2015. The current usage metrics is available 48-96 hours after online publication and is updated daily on week days.
Initial download of the metrics may take a while.