Fig. 9.
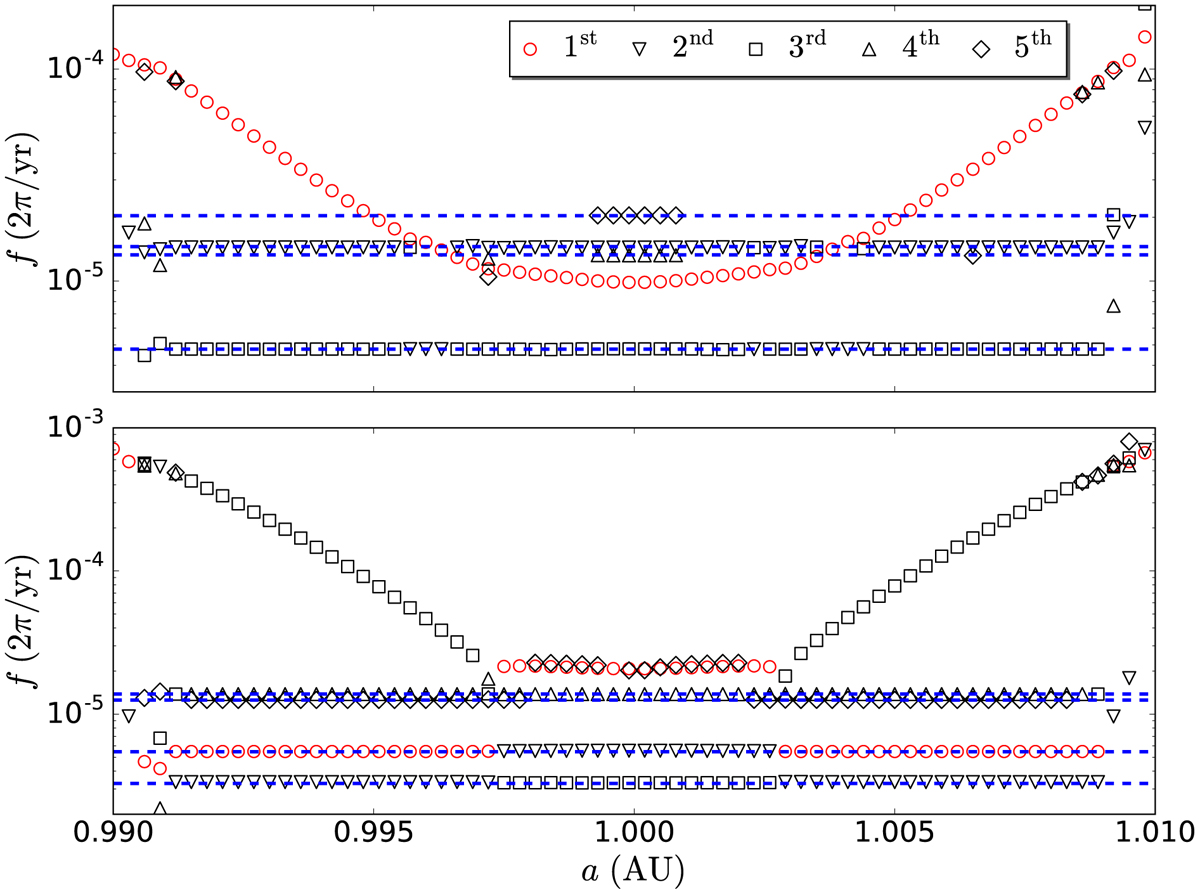
Dynamical spectra of icosΩ (top panel) and ecosϖ (bottom panel) for orbits with initial inclinations i0 = 2°. The five most significant frequencies for each orbit are plotted against their initial semi-major axes. The frequencies with the largest amplitudes are labelled by red open circles while the second to the fifth are denoted by black open inverted triangles, squares, triangles, and diamonds, respectively. The blue dashed lines indicate the absolute values of the fundamental frequencies identified to be corresponding to forced frequencies. From top to bottom, they represent |s6|, |s3|, |s4|, 2g7 − s5, g4, g3 + s3 − s4, g2, and g5 respectively. We note that s3 and s4, (g3+s3−s4) and g4 are so close to each other that they are hardly distinguishable in the figure. Moreover, for a better vision, we just plot one-third of the data.
Current usage metrics show cumulative count of Article Views (full-text article views including HTML views, PDF and ePub downloads, according to the available data) and Abstracts Views on Vision4Press platform.
Data correspond to usage on the plateform after 2015. The current usage metrics is available 48-96 hours after online publication and is updated daily on week days.
Initial download of the metrics may take a while.