Fig. 3.
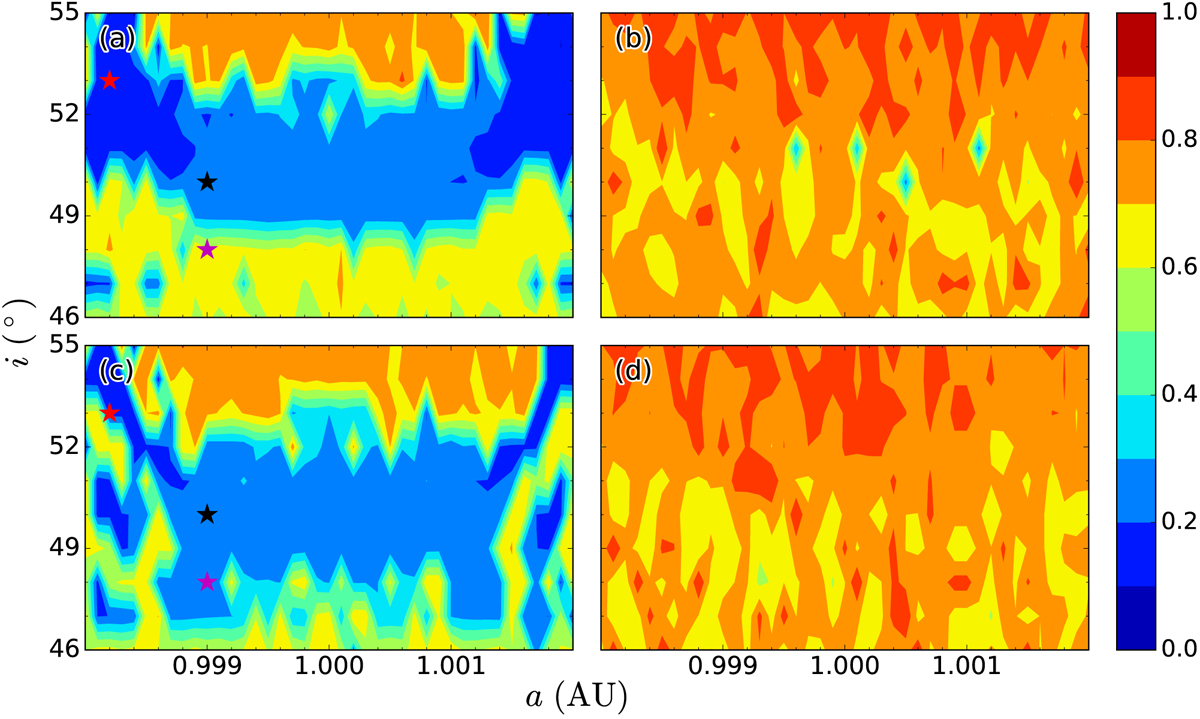
Dynamical maps for the possible stability window around i = 50° (Dvorak et al. 2012) on the (a0, i0) plane. The colour indicates the maximum eccentricity during the integration time. The four panels stand for the results derived from different models and integration times: Ve2Sa and integrated for 1 Myr (panel a), Ve2Sa for 12 Myr (panel b), Ve2Ne for 1 Myr (panel c), and Ve2Ne for 12 Myr (panel d). The stars in panelsa and c indicate the initial conditions for the orbits shown in Fig. 4. Magenta, black, and red stand for (a0, i0)=(0.9990, 48 ° ), (0.9990, 50 ° ) and (0.9982, 53 ° ), respectively.
Current usage metrics show cumulative count of Article Views (full-text article views including HTML views, PDF and ePub downloads, according to the available data) and Abstracts Views on Vision4Press platform.
Data correspond to usage on the plateform after 2015. The current usage metrics is available 48-96 hours after online publication and is updated daily on week days.
Initial download of the metrics may take a while.