Fig. 13.
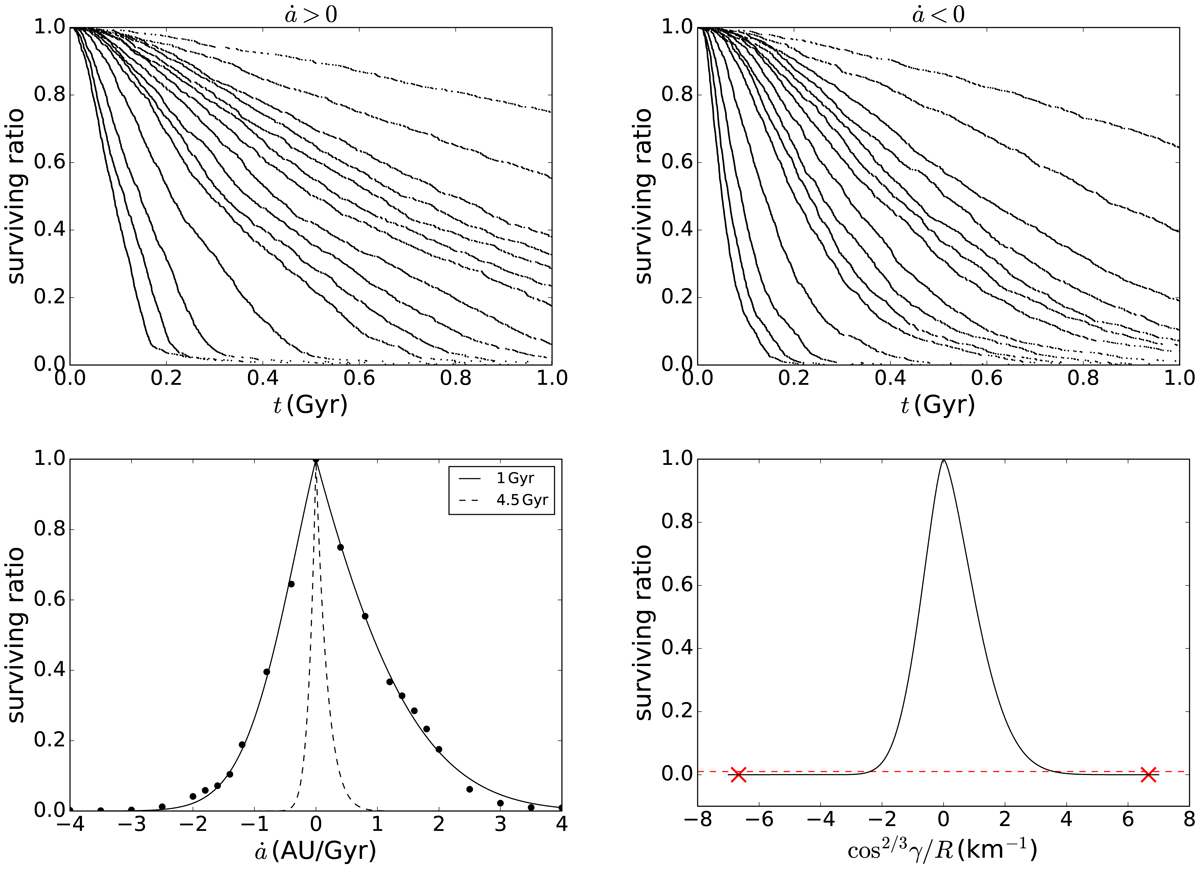
Surviving ratio against evolution time for prograde spinning Trojans (![]() , upper left panel) and retrograde rotators (
, upper left panel) and retrograde rotators (![]() , upper right panel). In both panels, the drift rate
, upper right panel). In both panels, the drift rate ![]() increases from 0.4 to 4 AU/Gyr for lines from top right to bottom left. In the two lower panels, the surviving ratio at 1 Gyr is plotted against the drift rate
increases from 0.4 to 4 AU/Gyr for lines from top right to bottom left. In the two lower panels, the surviving ratio at 1 Gyr is plotted against the drift rate ![]() (left) and cos2/3γ/R (right). The black points are numbers from the integrations and the solid curve represents the numerical fit. The dashed line stands for the surviving ratio at 4.5 Gyr obtained by the extrapolation of Eq. (15). In the lower right panel, the solid curve is transformed from the dashed line in the left panel (surviving ratio at 4.5 Gyr) via Eq. (14). The red crosses represent the surviving ratio for γ = 0 ° ,R = 150 m and γ = 180 ° ,R = 150 m. The red horizontal dashed line indicates a surviving ratio of p = 1%.
(left) and cos2/3γ/R (right). The black points are numbers from the integrations and the solid curve represents the numerical fit. The dashed line stands for the surviving ratio at 4.5 Gyr obtained by the extrapolation of Eq. (15). In the lower right panel, the solid curve is transformed from the dashed line in the left panel (surviving ratio at 4.5 Gyr) via Eq. (14). The red crosses represent the surviving ratio for γ = 0 ° ,R = 150 m and γ = 180 ° ,R = 150 m. The red horizontal dashed line indicates a surviving ratio of p = 1%.
Current usage metrics show cumulative count of Article Views (full-text article views including HTML views, PDF and ePub downloads, according to the available data) and Abstracts Views on Vision4Press platform.
Data correspond to usage on the plateform after 2015. The current usage metrics is available 48-96 hours after online publication and is updated daily on week days.
Initial download of the metrics may take a while.