Fig. 1.
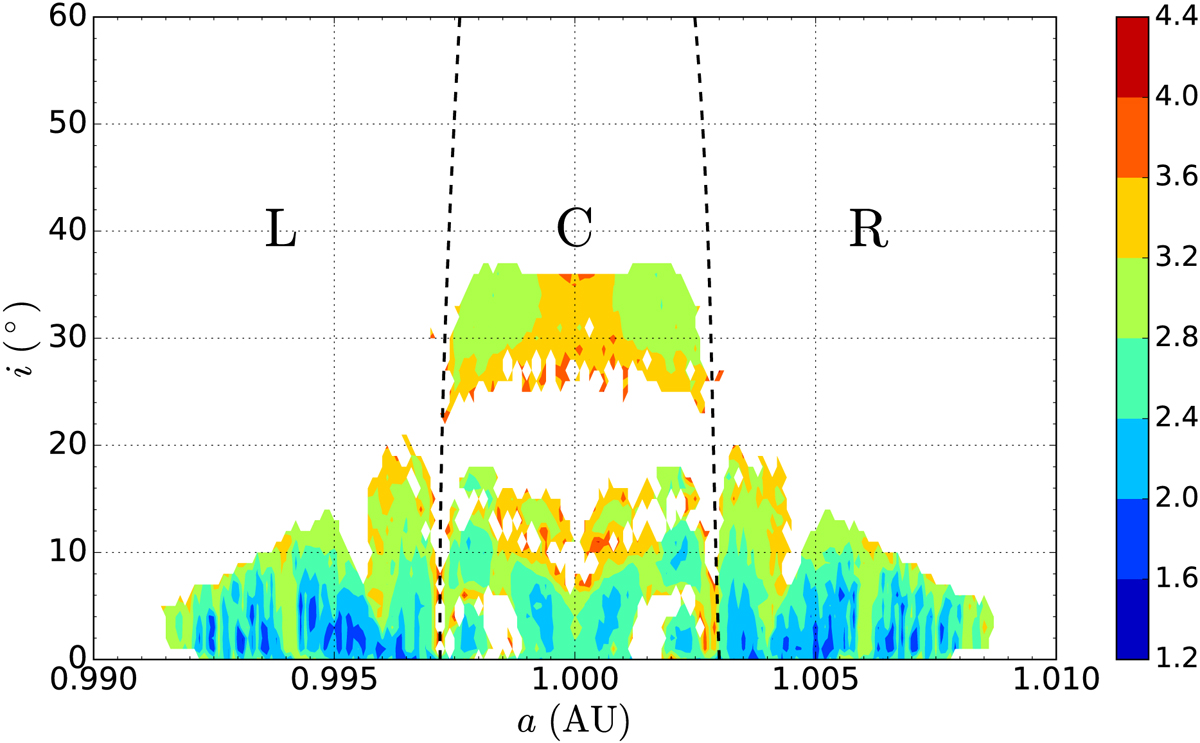
Dynamical map around the L4 point on the (a0, i0) plane. The colour indicates the SN of cosσ, which is shown on a base-10 logarithmic scale for more details. The orbits that escape from the Earth co-orbital region (see text) during the integration time (12 Myr) are excluded. The dashed lines indicate the separatrices between the tadpole and horseshoe orbits (see text in Sect. 4.2), which divide the dynamical map into three regimes. The tadpole orbits reside in the central region (denoted by “C”) while the horseshoe orbits are found in the left (“L”) and right (“R”) regions.
Current usage metrics show cumulative count of Article Views (full-text article views including HTML views, PDF and ePub downloads, according to the available data) and Abstracts Views on Vision4Press platform.
Data correspond to usage on the plateform after 2015. The current usage metrics is available 48-96 hours after online publication and is updated daily on week days.
Initial download of the metrics may take a while.