Fig. 8
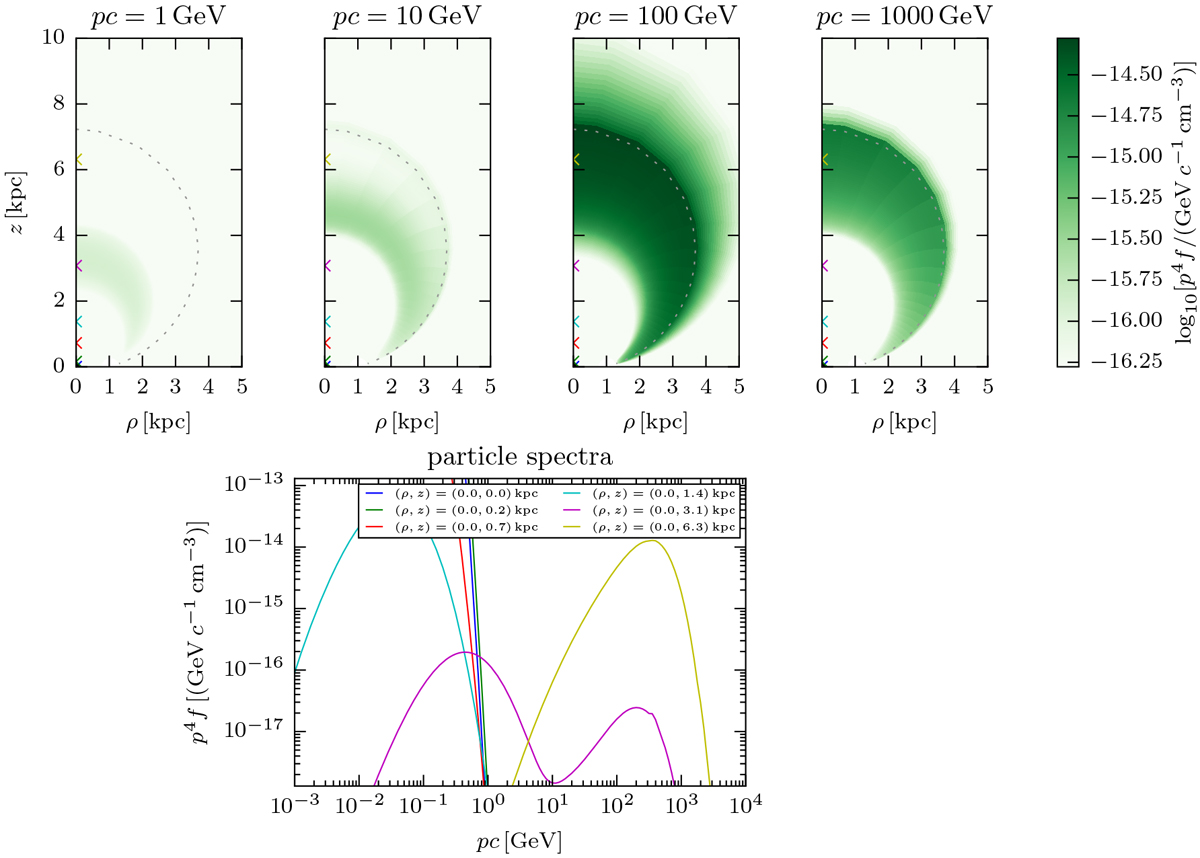
Top panels: distribution of electron energy p4f ~ p2ψ ~ E2n at momenta pc = 1, 10, 102, 103 GeV for model 3 at time t = 2.4 × 10⁷ yr. The black star marks the position of the source where electrons get steadily injected with a momentum pc = 10−2 GeV and the dashed circle is the shock position at t = 2.4 × 10⁷ yr. The coloured crosses mark the positions for which the electron spectra are shown in the bottom panel of this figure. Bottom panel: spectra p4f at time t = 2.4 × 10⁷ yr for the six positions marked by the crosses in the top panel of this figure.
Current usage metrics show cumulative count of Article Views (full-text article views including HTML views, PDF and ePub downloads, according to the available data) and Abstracts Views on Vision4Press platform.
Data correspond to usage on the plateform after 2015. The current usage metrics is available 48-96 hours after online publication and is updated daily on week days.
Initial download of the metrics may take a while.