Fig. 5
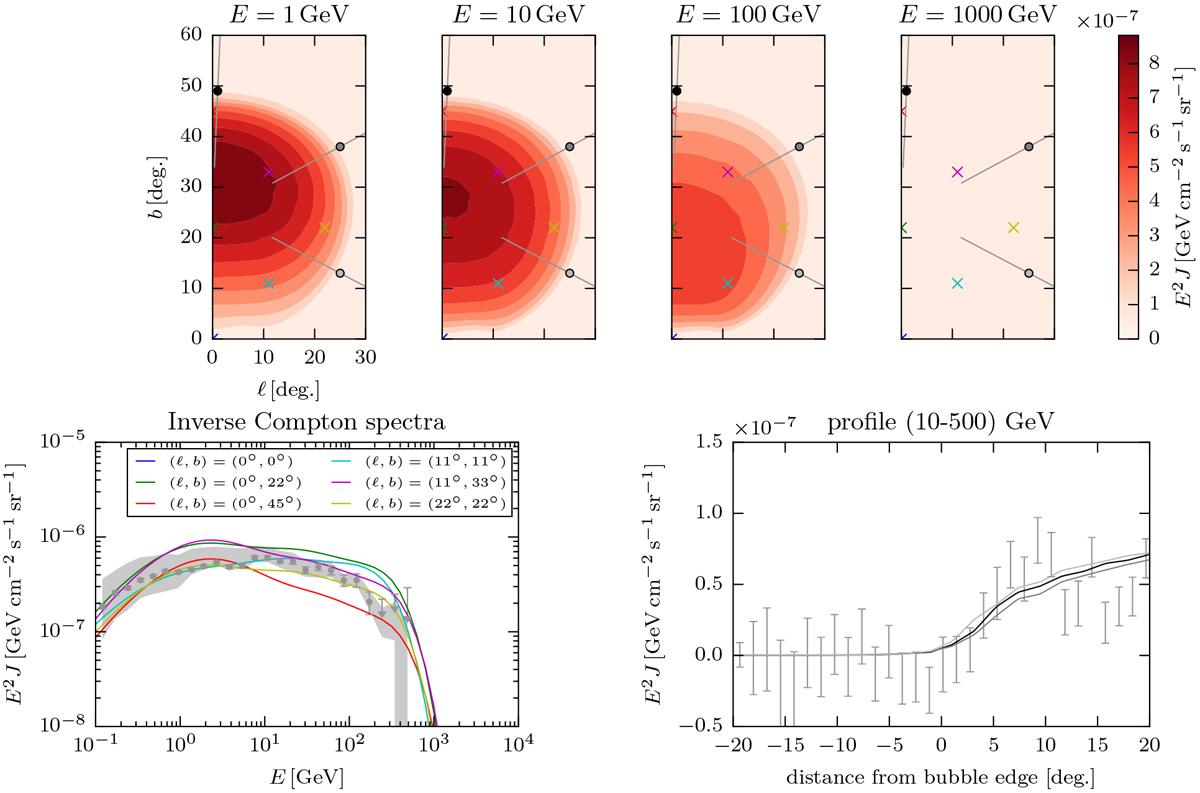
Top panels: gamma-ray sky maps at E = 1, 10, 102 and 103 GeV for model 1 (homogeneous bubble, isotropic diffusion) at time t = 2.4 × 10⁷ yr. The coloured crosses show the directions for which the gamma-ray spectra are shown in the bottom left panel of this figure. The three dots mark the directions where the gradient angular directions are computed and the lines show these directions. The gamma-ray profile along these is shown in the bottom right panel of this figure. Bottom left panel: gamma-ray spectra in the directions marked by the crosses in the top panel of this figure. The data points are from Ackermann et al. (2014), showing the statistical errors only, the shaded band is reflecting the systematic uncertainty. Bottom right panel: angular profiles along the directions shown in the top panel of this figure for gamma-rays in the energy range 10− 500 GeV. The data points are again from Ackermann et al. (2014).
Current usage metrics show cumulative count of Article Views (full-text article views including HTML views, PDF and ePub downloads, according to the available data) and Abstracts Views on Vision4Press platform.
Data correspond to usage on the plateform after 2015. The current usage metrics is available 48-96 hours after online publication and is updated daily on week days.
Initial download of the metrics may take a while.