Free Access
Fig. 2
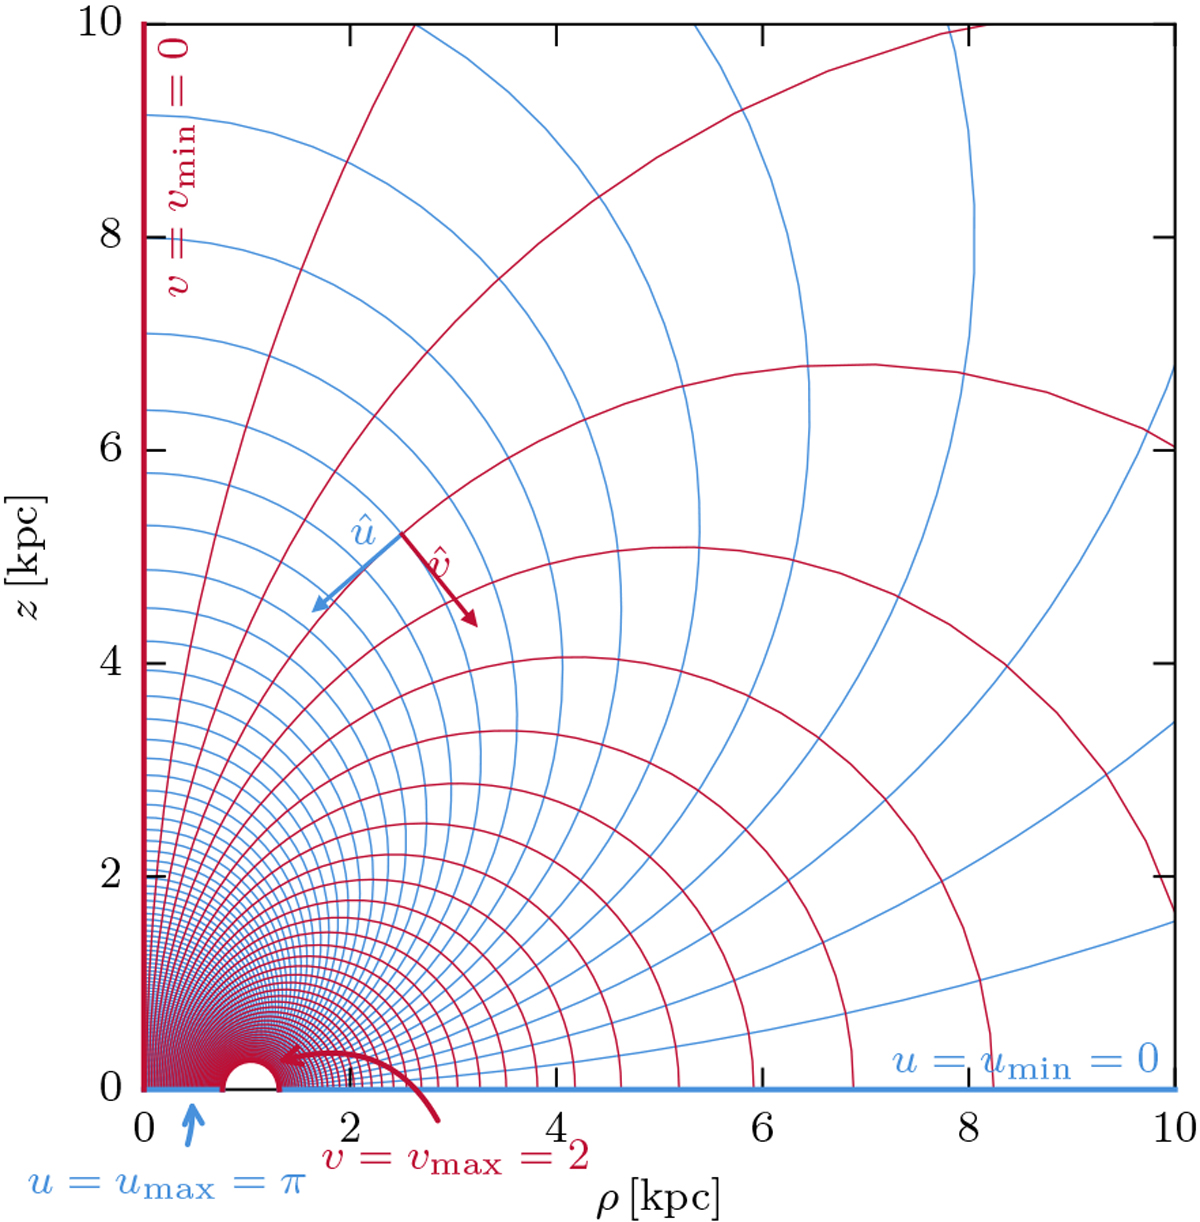
Spatial part of the computational grid. For clarity, we only show n = 100 spacings in the u-direction here, whereas in the numerical simulations, we have chosen n = 800 throughout. Note also that the use of vmax = 2 instead of ∞ ignores a small region of space.
Current usage metrics show cumulative count of Article Views (full-text article views including HTML views, PDF and ePub downloads, according to the available data) and Abstracts Views on Vision4Press platform.
Data correspond to usage on the plateform after 2015. The current usage metrics is available 48-96 hours after online publication and is updated daily on week days.
Initial download of the metrics may take a while.