Fig. A.1.
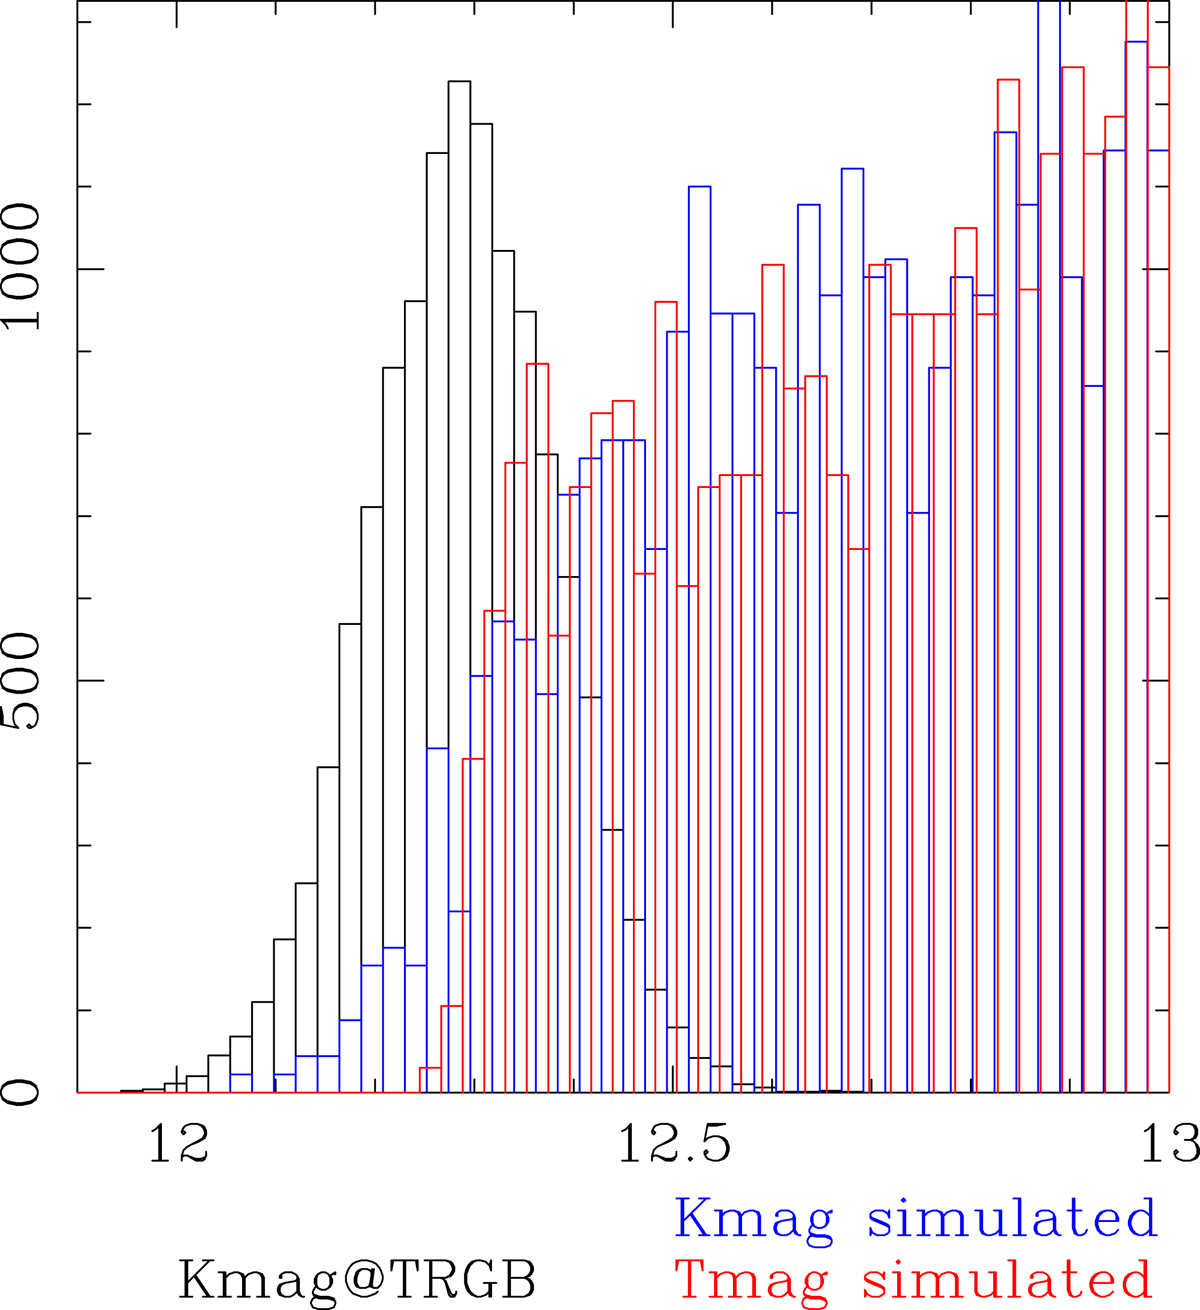
For a Gaussian distribution of the (J − K) colours at the TRGB with a width of 0.05 mag, and the relation between MK and (J − K) discussed in the text, the black histogram is the theoretical distribution of the K-mag of stars at the TRGB for a Galaxy at the distance of the LMC. Since the LF is sampled, the actual distribution of all RGB stars in K is the blue histogram. The cut-off is not sharp and samples neither the true brightest RGB stars, nor the peak in the true K-mag distribution. The red histogram shows the simulated distribution in T-mag (shifted by −2.013 < SPSDOUBLEDOLLAR > × the adopted mean (J − K) colour at the TRGB). The cut-off is much sharper.
Current usage metrics show cumulative count of Article Views (full-text article views including HTML views, PDF and ePub downloads, according to the available data) and Abstracts Views on Vision4Press platform.
Data correspond to usage on the plateform after 2015. The current usage metrics is available 48-96 hours after online publication and is updated daily on week days.
Initial download of the metrics may take a while.