Fig. 5.
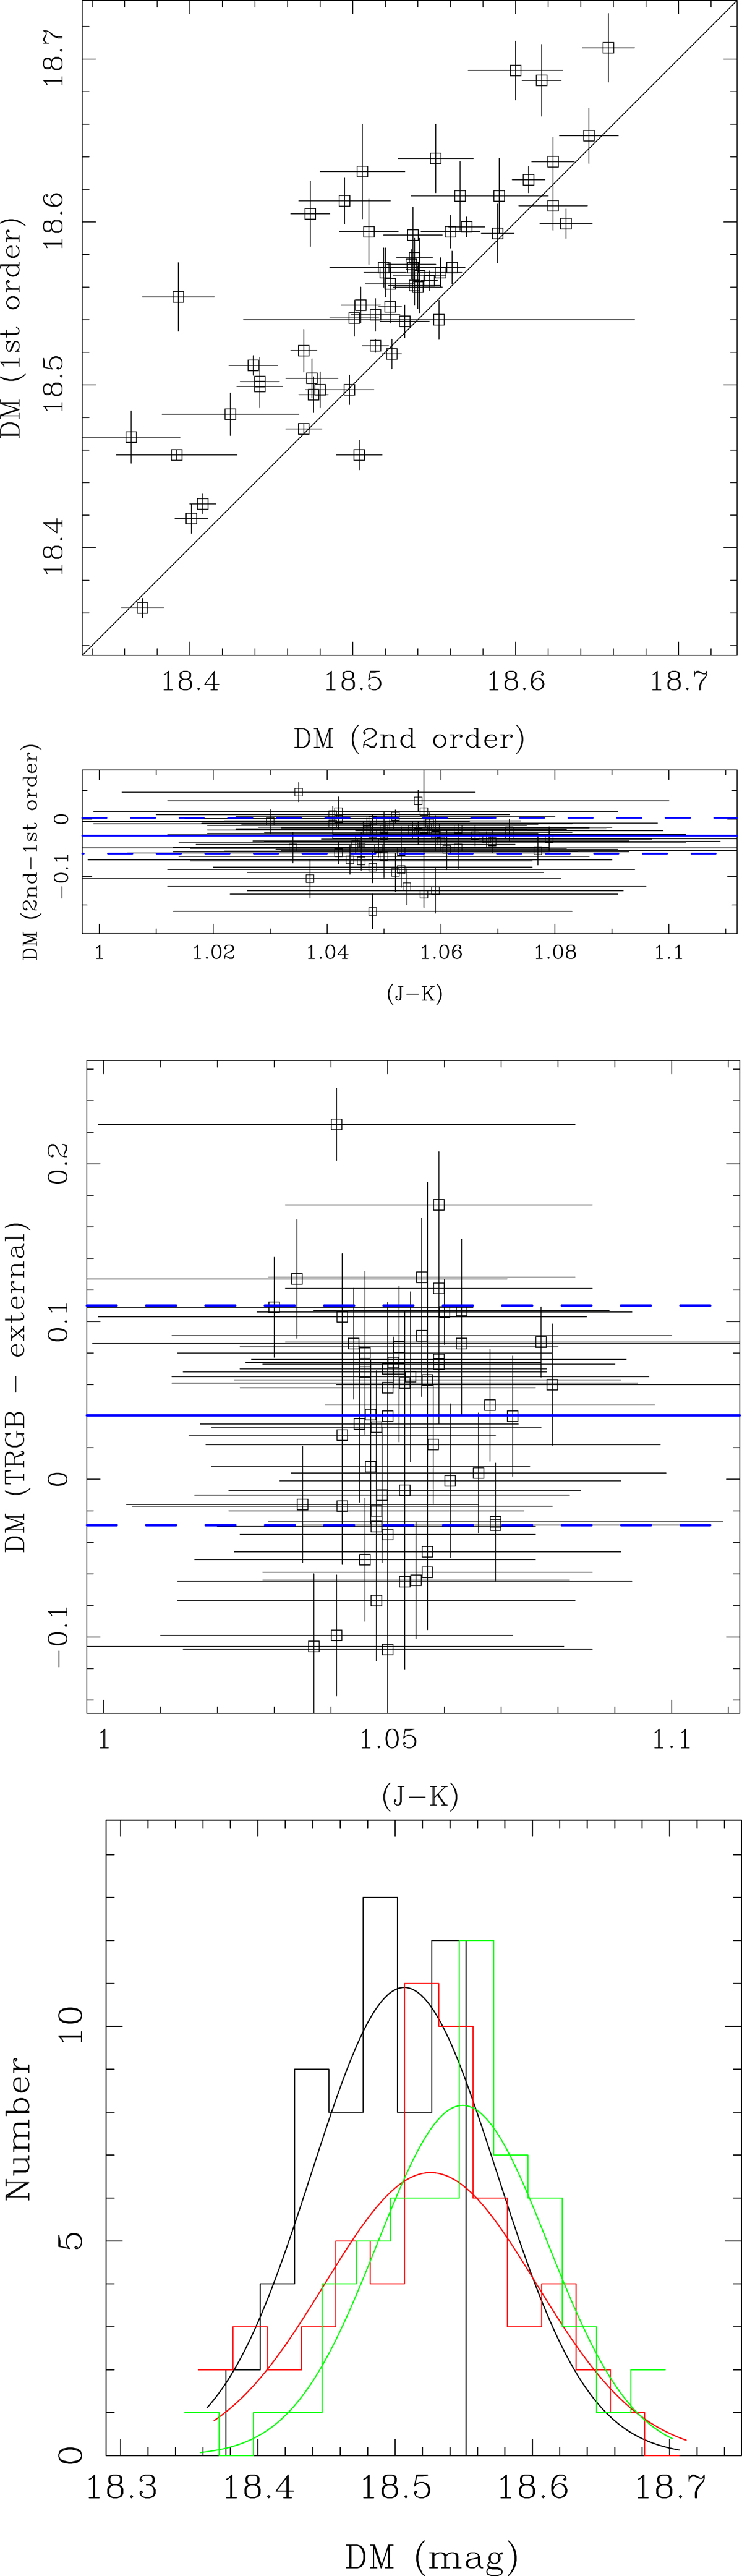
Same as Fig. 4 for 56 los towards CCs in the LMC. Additionally the bottom panel shows the distribution of the DM for the CCs (in black), and the first- (green) and second-order-based-derivative TRGB distance (red), and Gaussian fits to these distributions. For clarity, the green and red histograms have been offset by −0.005 and +0.005 mag from the black one.
Current usage metrics show cumulative count of Article Views (full-text article views including HTML views, PDF and ePub downloads, according to the available data) and Abstracts Views on Vision4Press platform.
Data correspond to usage on the plateform after 2015. The current usage metrics is available 48-96 hours after online publication and is updated daily on week days.
Initial download of the metrics may take a while.